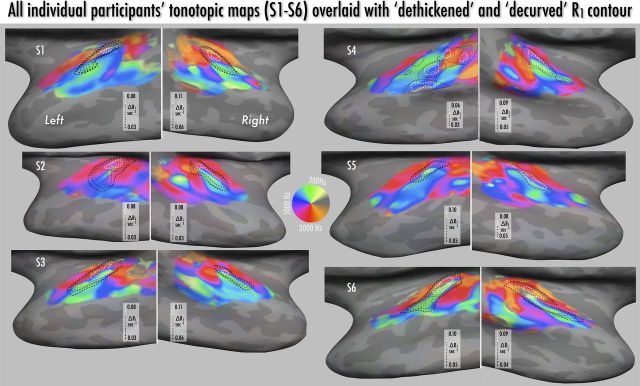
Figure 6.
Montage of individual participants' tonotopic maps and R1 contours, sampled halfway through cortex and detrended for effects of local curvature and thickness (see Materials and Methods and Fig. 3d). Tonotopic color maps are as in Figure 5. For visual clarity, contours indicate stepwise progression of R1 values in probable auditory core only; see heat scale images in Figure 4 for raw R1 data for each individual.

