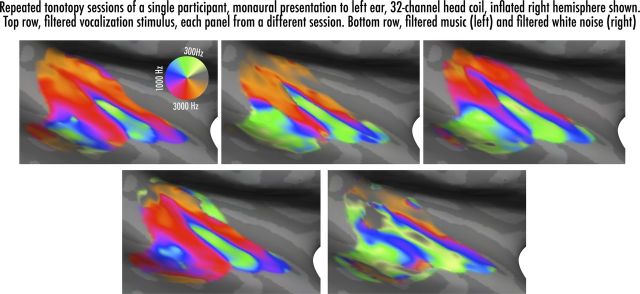
Figure 7.
Functional tonotopic maps of an individual subject with focus on the right hemisphere of the inflated superior temporal lobe. Top row shows results from three different sessions of tonotopy using bandpass-swept vocalization stimuli (four runs each); bottom left inset shows one session using bandpass-filtered music (four runs); and bottom right shows one session using bandpass-filtered, amplitude-modulated white noise (four runs).

