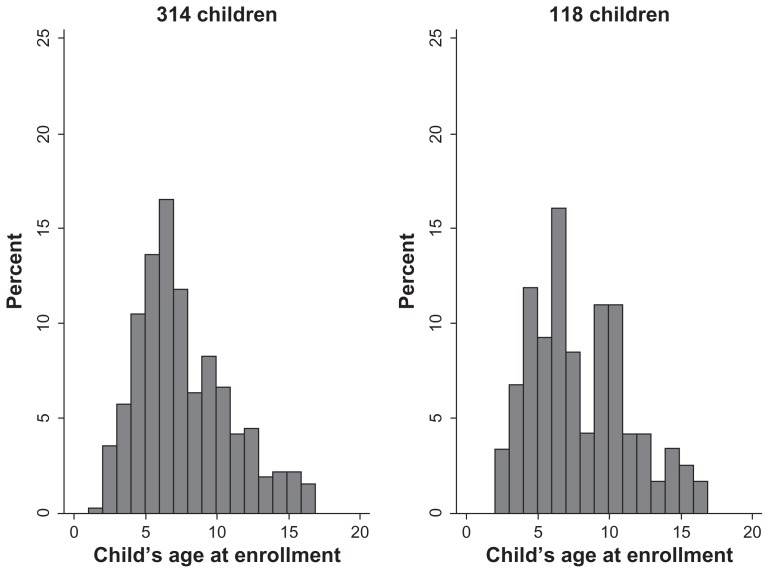
Figure 2.
Age distributions of the 314 children (mean age 7.2 ± 3.3 [range 1–17] years) with a clinical diagnosis at Mulago National Reference Hospital in Uganda and the 118 children (mean age 7.5 ± 3.5 [range 2–17] years) with complete diagnostic information.a
Note:aComplete diagnostic information includes the clinical diagnosis, the pathological diagnosis assigned in Uganda, and the pathological diagnosis assigned in The Netherlands.

