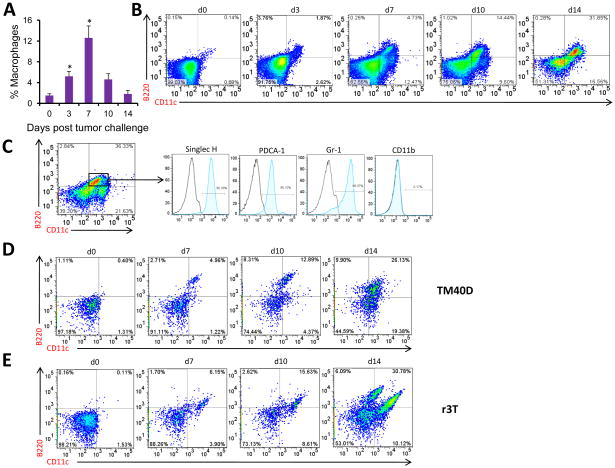
Figure 2. Numbers of pDC increase with increased dissemination of the breast cancer to bone.
(a) On days 3, 7, 10 and 14 following tumor cell injection, mice were sacrificed and BM cells were isolated as mentioned in Materials and Methods. The presence of macrophages was detected using anti-F4/80 and enumerated by flow cytometry. (b) pDC were detected by staining with B220 and CD11c antibodies and analyzed by flow cytometry. A representative data set from each time point is shown. (c) Presence of pDC (B220+CD11c+) was further confirmed with Singlec-H, PDCA- 1, Gr-1 and CD11b antibodies. Data are shown for mice 14 days post-tumor challenge. (d) BALB/c and 129S mice were injected with TM40D and r3T cells respectively via intra- cardiac route. pDC levels were evaluated by flow cytometry using B220 and CD11c, antibodies on days 7, 10 and 14 from BM, similar to that described above. Representative data from each time point for both the cell lines is provided here. Bone marrow cells were isolated from 6 mice for every time point and were treated as individual samples. For each sample, the above mentioned flow cytometry analysis was performed. This experiment was performed three times independently.

