
Figure 3.
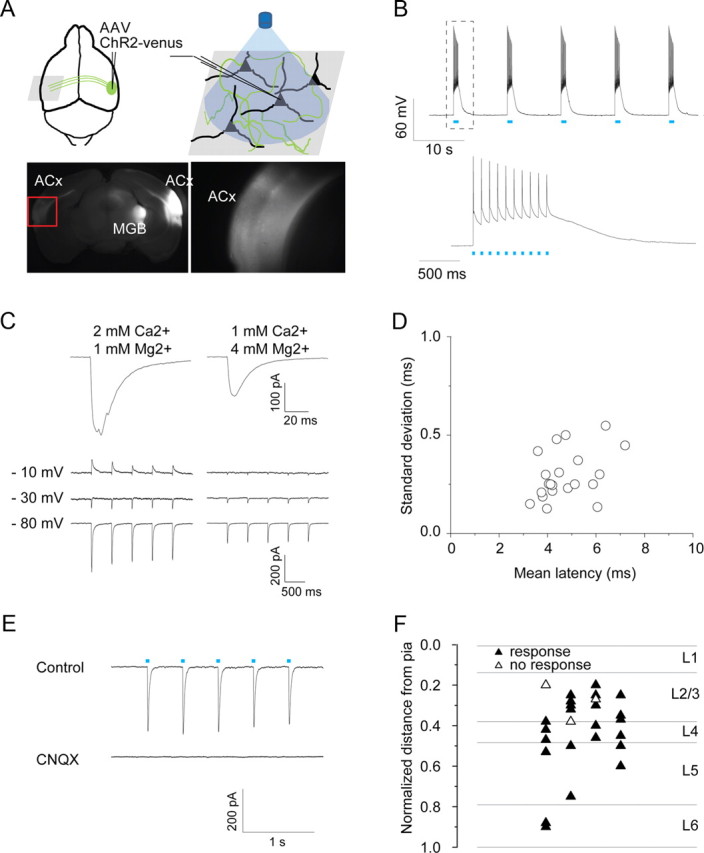
Long-range ChR2 mapping reveals that all layers receive callosal inputs. A, Following AAV-ChR2-venus injection into the right auditory cortex, fluorescent axons and synaptic terminals are seen at the injection site and in projection targets including ipsilateral thalamus and contralateral auditory cortex. Right image is an enlarged picture from red rectangle at left. B, action potentials elicited by blue light pulses (1 ms, 10 Hz, 475 nm) from virus-infected neurons on the right auditory cortex. C, Top, Examples of light-evoked EPSCs recorded at −70 mV for different extracellular divalent ion concentration. Under conditions of high release probability (left), responses are larger and multipeaked, indicating polysynaptic input. Reducing release probability (right) leads to smaller and smoother traces. Bottom, Example traces of single light-evoked EPSCs at different divalent ion concentrations when neurons were held at three voltages. At high release probability, there is a clear polysynaptic inhibitory component that is absent at low release probability. D, Mean latency versus SDs of EPSCs from individual cells. Average latency across cells is 4.7 ± 0.2 ms, average SD is 0.30 ± 0.02 ms (n = 23). E, Light-evoked EPSCs are blocked by application of CNQX (50 μm). Cells were held at −70 mV under voltage-clamp. F, Laminar distribution of neurons tested. The distance from pia to white matter in each brain slice was normalized, and the distance to the pia from each recorded neuron was measured. The horizontal position is randomly assigned. Data are presented as mean ± SE.