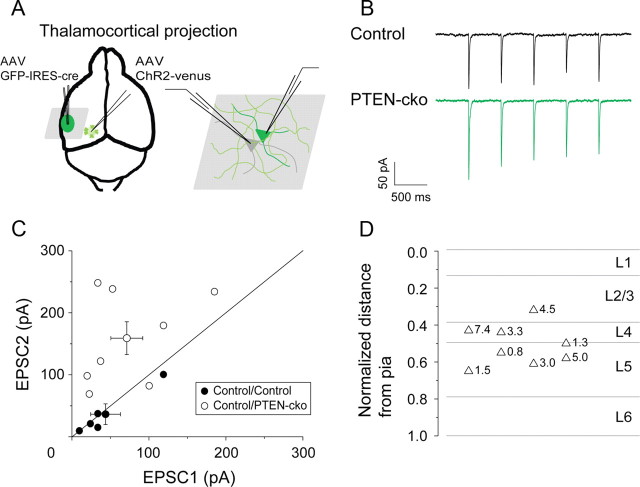
Figure 5.
PTEN deletion enhances synaptic responses to thalamic inputs on PTEN-cko neurons. A, Experimental strategy. AAV-ChR2-venus was injected into left MGB, and AAV-GFP-IRES-Cre was injected into left auditory cortex. B, Example traces of EPSCs elicted by blue light pulses (1 ms, 2 Hz, 475 nm). C, EPSC amplitude scatter plot for each pair of recorded neurons (closed circles: control vs control neurons; open circles: control vs PTEN-cko neurons; circles with error bars: mean values and SEs for each group). D, Laminar distribution of control/PTEN-cko pairs (n = 8), indicating relative EPSC enhancement (PTEN-cko/control) at each site.

