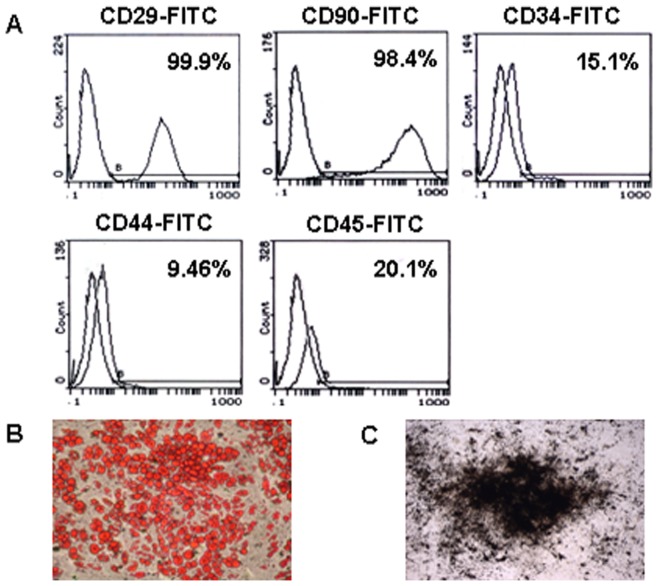
Figure 1. Characterization of MSC.
(A) Phenotype characterization of MSC. Flow Cytometry analysis showed that almost all the cultured MSC expressed CD29 (98.4%) and CD90 (99.9%) while a small portion of MSC expressed CD34 (15.1%), CD44 (9.46%), and CD45 (20.1%). (B–C) Multipotential differentiation of MSC. MSC differentiation to adipocytes was shown by Oil-O-Red staining (B); and Osteoblast differentiation was detected by AgNO3 staining (C).

