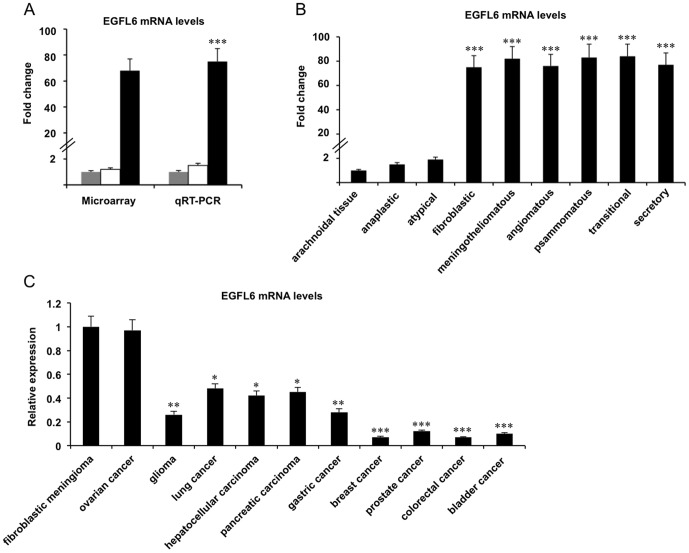
Figure 4. EGFL6 gene expression in brain arachnoidal tissue and various tumors.
(A) EGFL6 gene expression in brain arachnoidal tissue (grey bars) (n = 3), tissues of anaplastic (white bars) (n = 6) and fibroblastic (black bars) (n = 10) meningiomas by microarray and qRT-PCR. EGFL6 mRNA levels in tissues of anaplastic and fibroblastic meningiomas are shown in each graph when the EGFL6 gene expression in brain arachnoidal tissue is set to 1. ***P<0.001. (B) EGFL6 mRNA levels in meningiomas with different histological types are shown in each graph when the EGFL6 gene expression in brain arachnoidal tissue is set to 1. Each tumor had 6 different samples investigated, except fibroblastic meningioma with 10. ***P<0.001. (C) EGFL6 mRNA levels in various tumors are shown in each graph when the EGFL6 gene expression in fibroblastic meningioma is set to 1. Each tumor had 6 different samples investigated. *P<0.05, **P<0.01, ***P<0.001.

