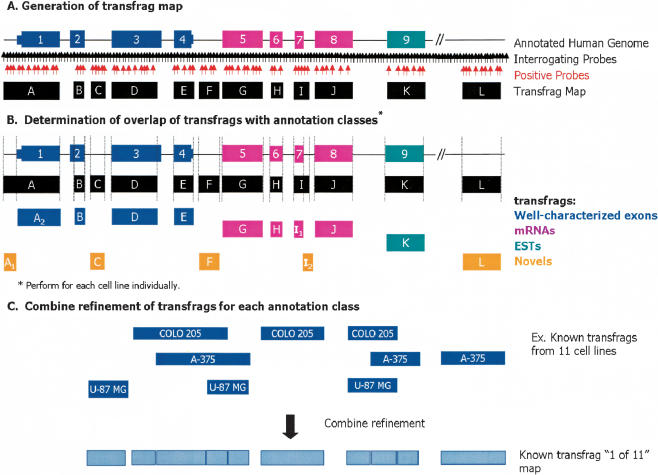
Figure 1.
Schematic representation of tiled probe pairs and generation of transfrags from human Chromosomes 21 and 22 oligonucleotide arrays. Schematic representation of oligonucleotide arrays interrogating the entire nonrepetitive regions of human Chromosomes 21 and 22 with probes regularly spaced at ∼35-bp intervals. (A) Generation of transfrag map. At each probe position, a bandwidth of 50 was used to determine positive probes above a threshold of 150 (indicated in red) wherein the pseudo-median values for each position are recomputed as a pseudo-median of all probes in the window using the Hodges-Lehmann estimator. Fragments of contiguously transcribed elements termed transfrags were generated by joining positive probes that were separated by a certain distance (maxgap = 40) and whose length was less than a particular size (minrun = 90). (B) Portions of transfrags based on annotations. The transfrags were delineated into the following classes based on their overlap with a predefined set of annotations: (1) well-characterized exons (dark blue); (2) mRNAs (pink); and (3) ESTs (green). Any observed transcription outside of these annotation classes was considered novel (orange). The vertical lines indicate the boundaries of the transfrags. (C) Combined refinement of transfrags for each annotation class. Following this classification, all transfrags that belong to a particular class are combined to form a comprehensive nonoverlapping union of transfrags termed a “1 of 11” map.

