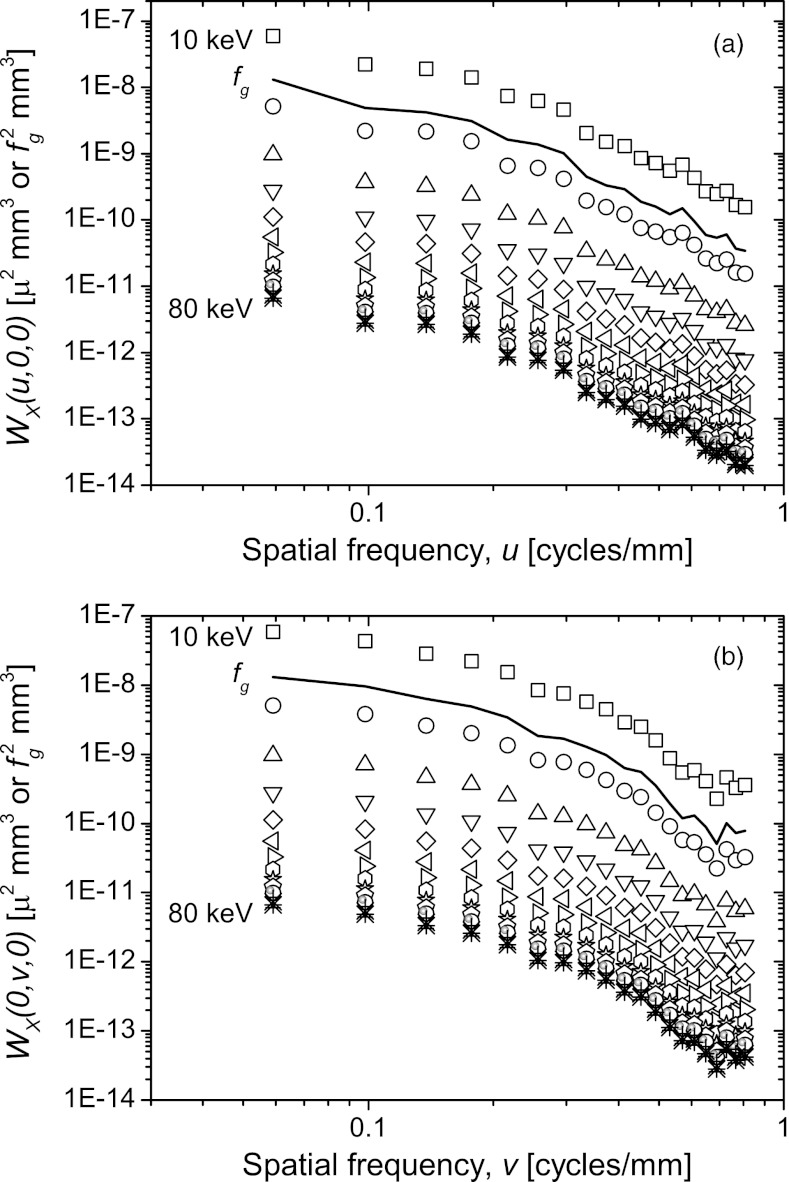
Figure 5.
The 1D anatomic power spectra (log-log scale) along the u and v axes in the spatial frequency range from 0.06 to 0.8 cycles/mm. The power spectrum of the glandular weight distribution (fg) is also shown as solid line. The symbols represent the power spectrum computed at each of the x-ray photon energies. The spatial frequency dependence of the anatomic power spectra at all energies and that of fg are similar.

