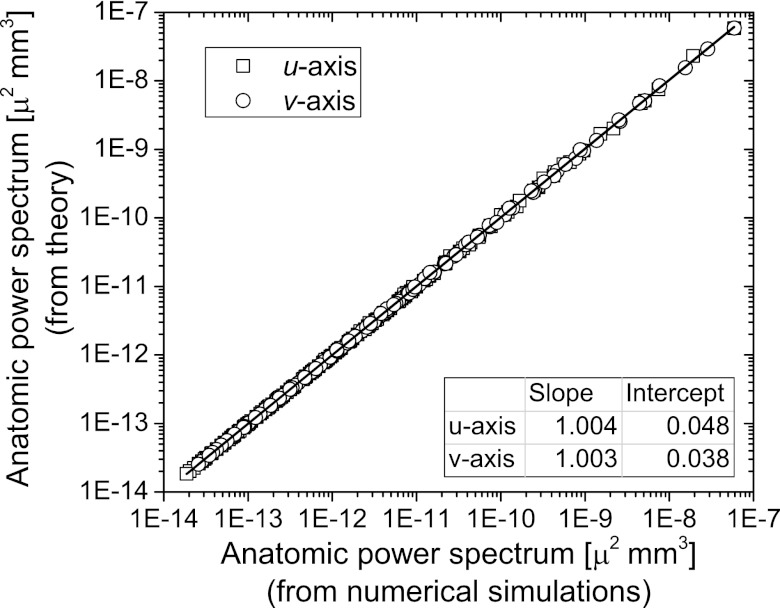
Figure 8.
Linear regression analysis of the anatomic power spectrum from numerical simulations with that determined from theory. The adjusted r2 value was greater than 0.99 indicating good correspondence between the theory and simulations. The near-zero intercept and near-unity slope indicated good agreement between theory and simulations.

