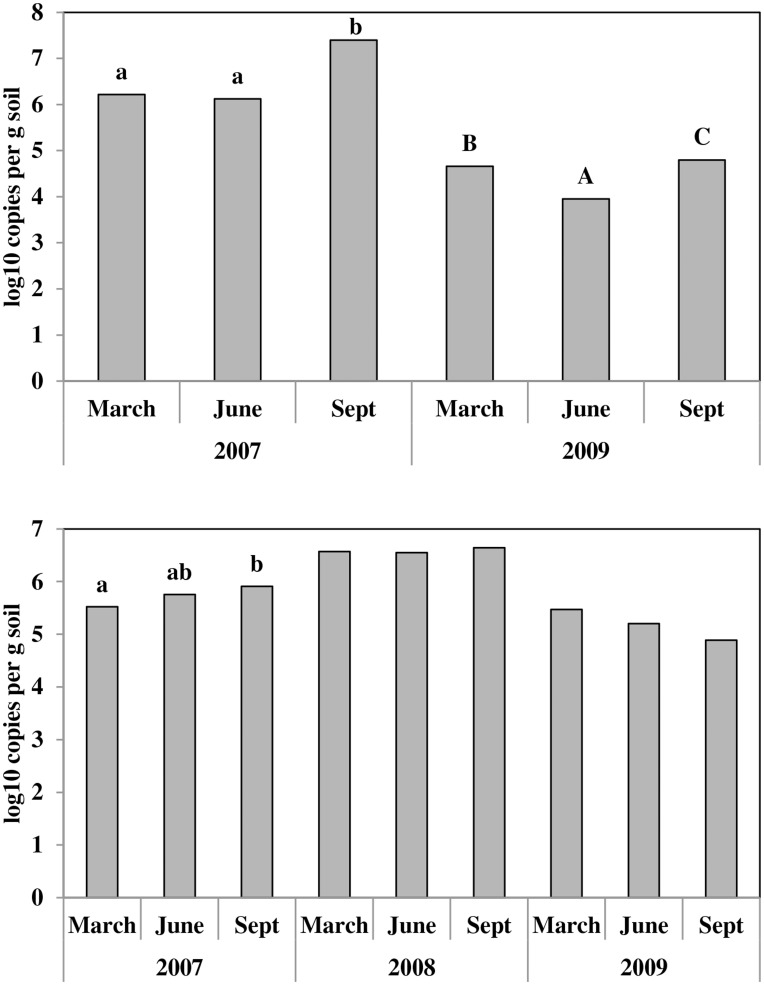
Figure 3. Showing copy numbers of the nifH mRNA transcript and the nifH gene.
nifH mRNA transcripts shown in the top and nifH gene in the bottom panels respectively. Bars labelled with the same letter in the same year are not different (P = 0.05). Unlabelled bars in the same year are not significantly different.

