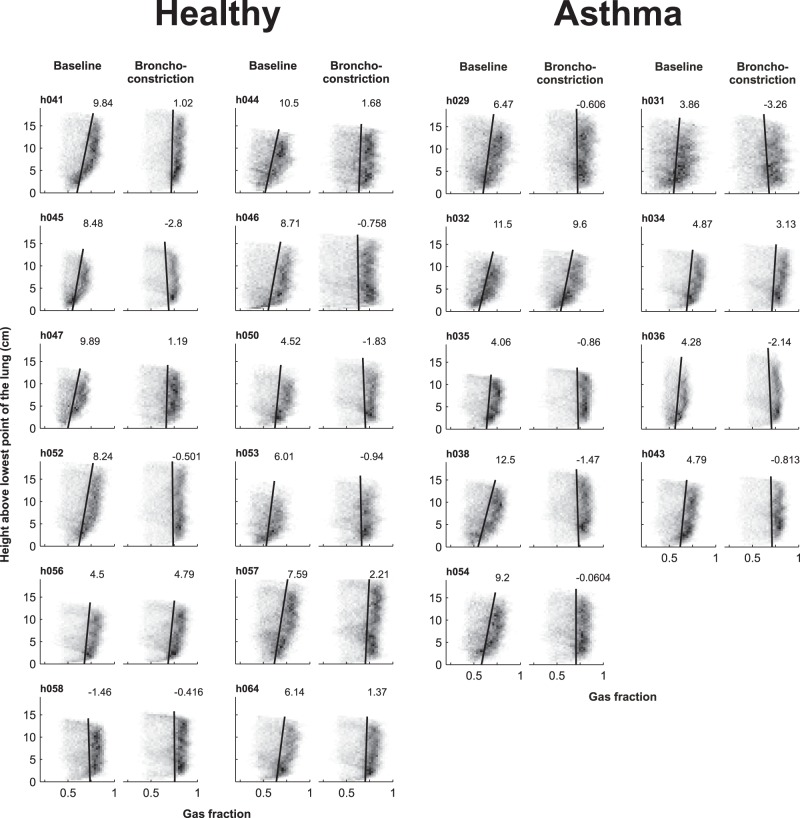
Figure 5. Fractional gas content (Fgas) gradients in healthy controls and subjects with asthma at baseline and during bronchoconstriction.
The grayscale of the squares in the plots corresponds to the number of data points with that value such that the darker the square, the greater the number of points with that value. The linear regression line (solid black) is shown and the number at the top of each line is the gradient (×10−3/cm) for each plot.

