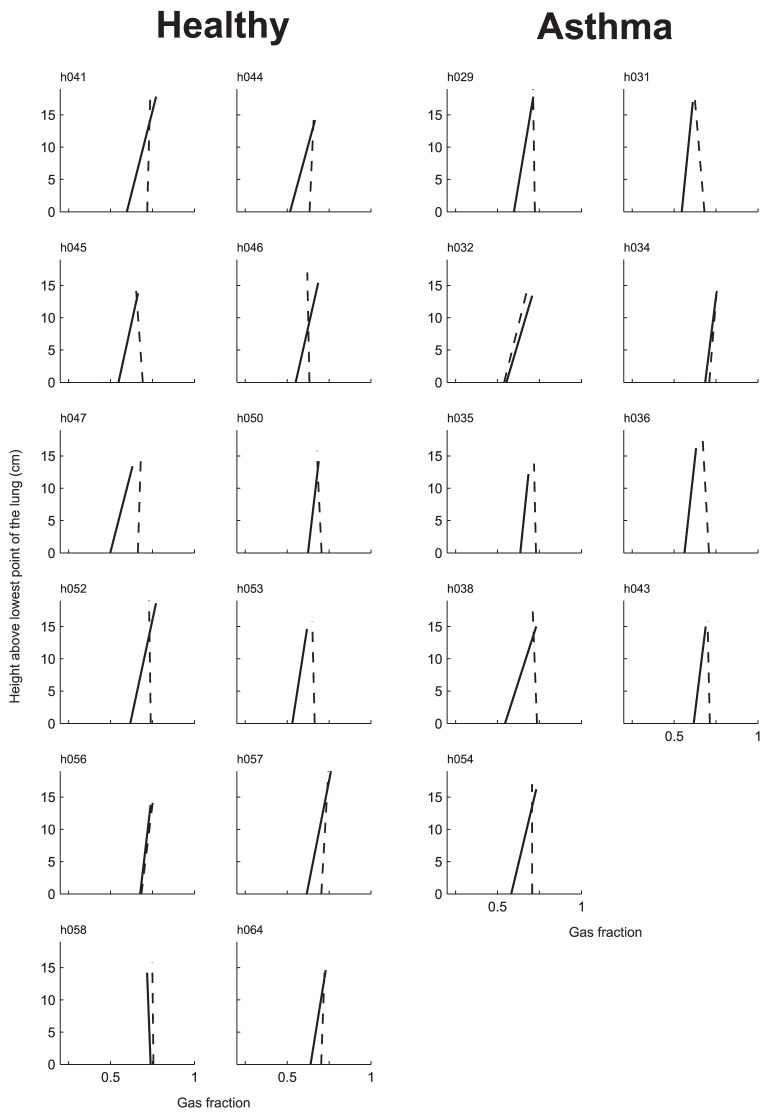
Figure 6. Height above the lung versus gas fraction (Fgas) at baseline (solid line) and during bronchoconstriction (dotted line).
Except for h056 and h058 in the healthy control group and h032 and h034 in the asthma group, the observed increase in mean lung Fgas was mostly due to an increase in Fgas in the most dependent lung.

