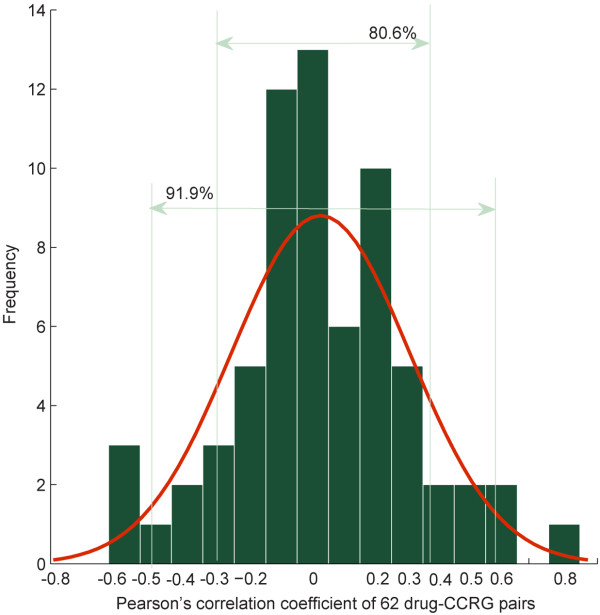
Figure 2.
The distribution of Pearson’s correlation coefficient (PCC) of drug-CCRG pairs. The x-axis represents PCC, the y-axis represents the frequency of a certain PCC. The value 80.6% indicates that drug-CCRG pairs whose PCC range from −0.3 to 0.3 accounts for 80.6% of all drug-CCRG pairs; 91.9% indicates that drug-CCRG pairs whose PCC range from −0.5 to 0.5 accounts for 91.9% of all drug-CCRG pairs.

