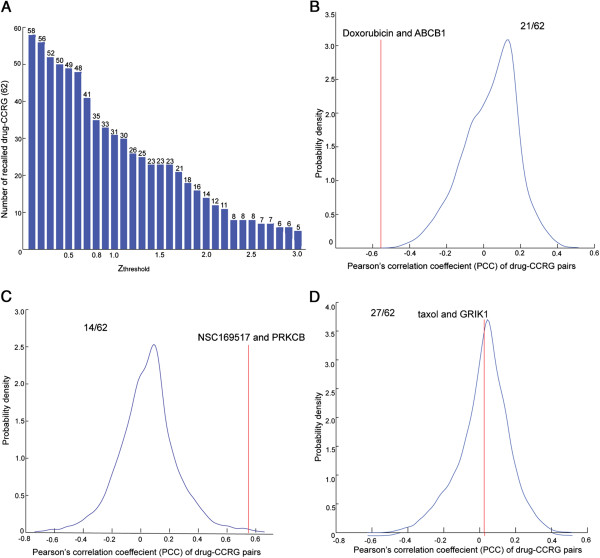
Figure 3.
Correlation-based analysis of the drug-CCRG pairs. (A) For each of the 62 drug-CCRG pairs, we compared the PCC of drug-CCRG with that of random drug-gene pairs. The numbers of drug-CCRG pairs, which were identified under the corresponding zthreshold, were listed over the blue bar. We set zthreshold to 0.8 in concordance with previous reports (Proc Natl Acad Sci U S A 2001, 98:10787–10792). Under this threshold, we conducted further analysis (Figure 3B, Figure 3C, and Figure 3D). (B, C, D) Three types of PCC distribution compared to random PCC. The x-axis shows the PCC of drug-gene pair, the y-axis shows the probability density value of PCC. The red line represents the PCC of a drug-CCRG pair, while the blue curves shows the distribution of PCC of random drug-gene pairs. (B) PCC of drug-CCRG is significantly smaller than PCC of random drug-gene pairs. 21/62 indicates that 21 of 62 drug-CCRG pairs exhibit PCCs significantly smaller than random PCCs. We offered an example between doxorubicin and ABCB1. It was reported that ABCB1 overexpression predicts doxorubicin resistance. (C) PCC of drug-CCRG is significantly larger than that of random drug-gene pairs. 14/62 indicates that 14 of 62 drug-CCRG pairs exhibit PCCs significantly largerr than random PCCs. It was reported PRKCB can predict chemosensitivity of NSC169517. (D) PCC of drug-CCRG is similar with that of random drug-gene pairs. 27/62 indicates that 27 of 62 drug-CCRG pairs do not exhibit PCCs significantly different from random PCCs. It was reported that GRIK1 was able to predict chemosensitivity of paclitaxel (taxol).

