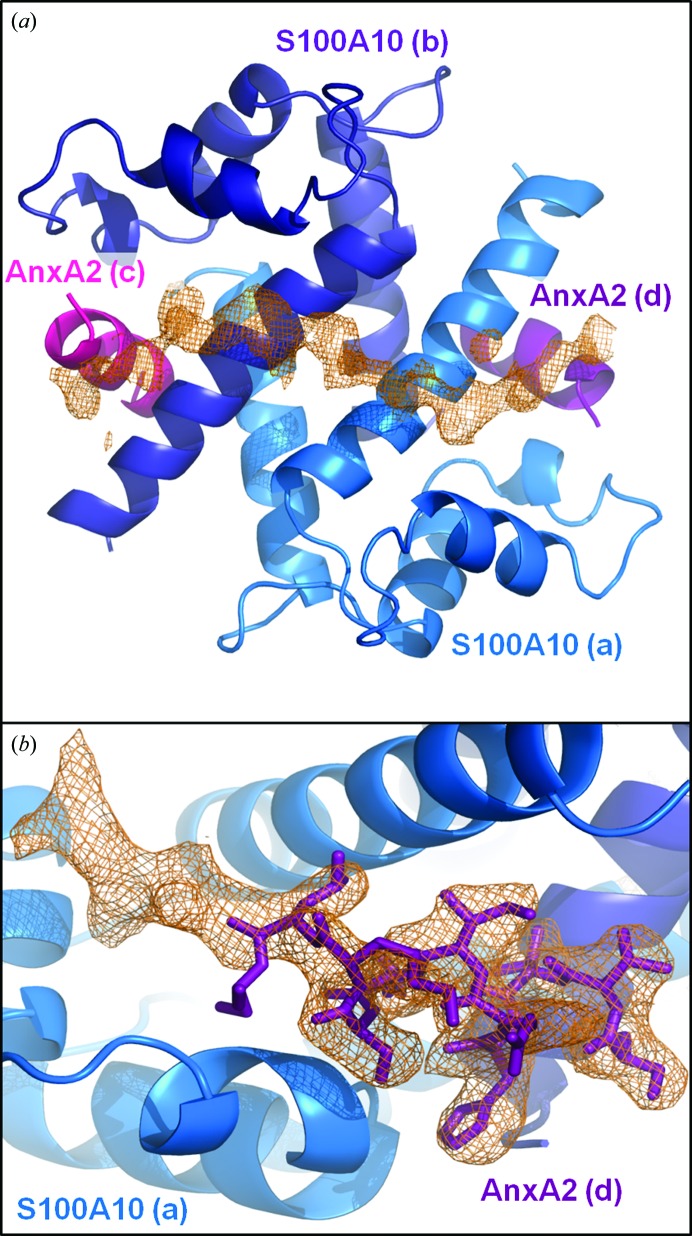
Figure 1.
Electron density of AHNAK peptide and extended AnxA2 peptide. (a) A continuous chain of unassigned electron density is clearly visible in the F o − F c map after initial refinement using the crystal structure of the apo S100A10–AnxA2 tetramer as a starting model (PDB entry 1bt6). S100A10 (marine and dark blue) and AnxA2 (magenta and purple) are shown as cartoon representations. The unassigned electron density stretches from one AnxA2 peptide, over the dimer interface of S100A10, to the second AnxA2 peptide. The map is contoured at 2σ. (b) Electron density seen in the 2F o − F c map after initial refinement supports an extension of the AnxA2 at the C-terminal end and a change of direction beginning with Ser12. Monomer A of S100A10 is depicted as a cartoon (marine) and the AnxA2 peptide (chain D) is shown as sticks (purple). The map is contoured at 1σ. Lower-case letters represent chain IDs.

