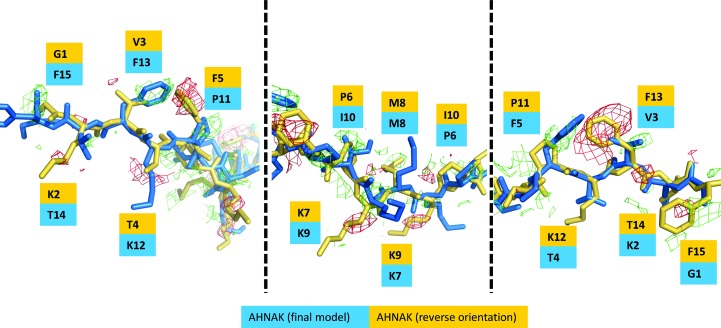
Figure 4.
Comparison of opposite orientations of the AHNAK peptide when bound to (p11)2(AnxA2)2. The orientation supported by electron density and part of the final model is represented in blue, while the hypothetical reverse orientation is colored yellow. An F o − F c difference map after refinement with the reverse orientation is shown in green (contoured at +2.5σ) and red (contoured at −2.5σ).

