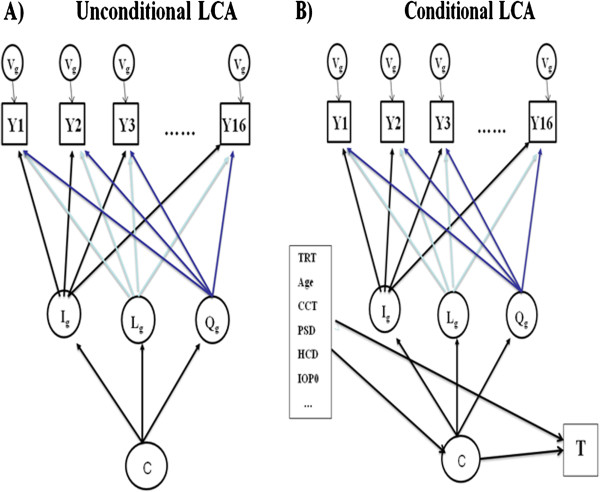
Figure 1.

Diagrams for unconditional (1A) and conditional (1B) latent class analysis (LCA) for OHTS data, where C denoted the latent classes. The trajectory of post-randomization IOP (Y) in each class was described by 4 class-specific parameters: the initial IOP level (I), the systematic linear (L) and quadratic (Q) trend over time, and the variance of IOP (V).
