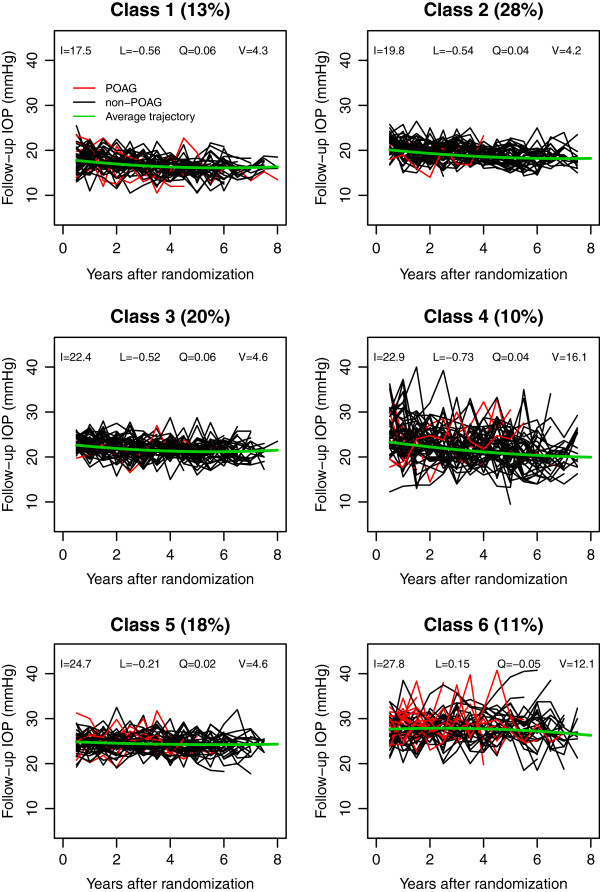
Figure 2.
Post-randomization IOP values for 50 subjects randomly selected from each of the 6 latent classes indentified in OHTS, where red lines represented subjects who developed POAG and the black lines were for those without POAG. The class membership was based on the posterior probabilities from the optimal unconditional LCA, and the 4 parameters (I, L, Q, and V) in the plots represented the estimated initial level, the systematic linear and quadratic trend over time, and the variance of post-randomization IOP respectively.

