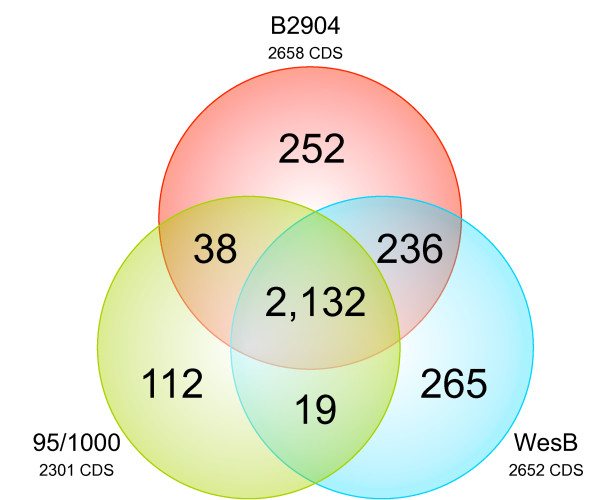
Figure 4.
Venn diagram of genes unique to and shared between B. pilosicoli strains 95/1000, B2904 and WesB. The Venn diagram was resolved via BLASTlineMCL protein clustering. Each circle represents the total number of protein-coding genes in the genome, whereby overlapping regions indicate the number of genes shared between the respective genomes.

