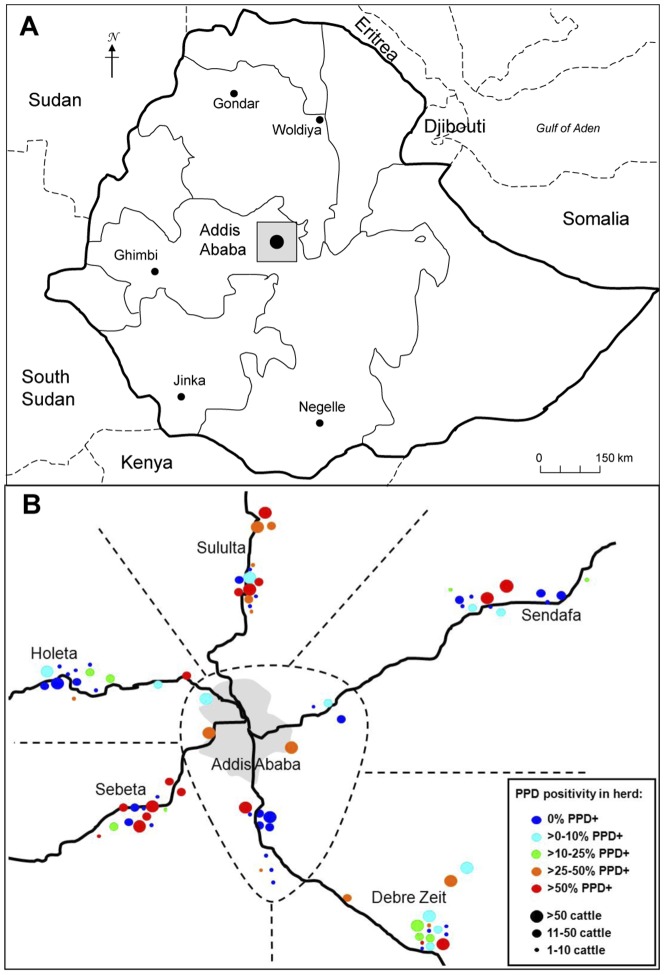
Figure 1. Mapping of (A) the study area (marked in grey) and other sites in Ethiopia where M. bovis isolates used in this study were collected, and (B) BTB prevalence in investigated farms in the five study areas.
PPD positivity and farm size category are defined by colour and size of respective circle.

