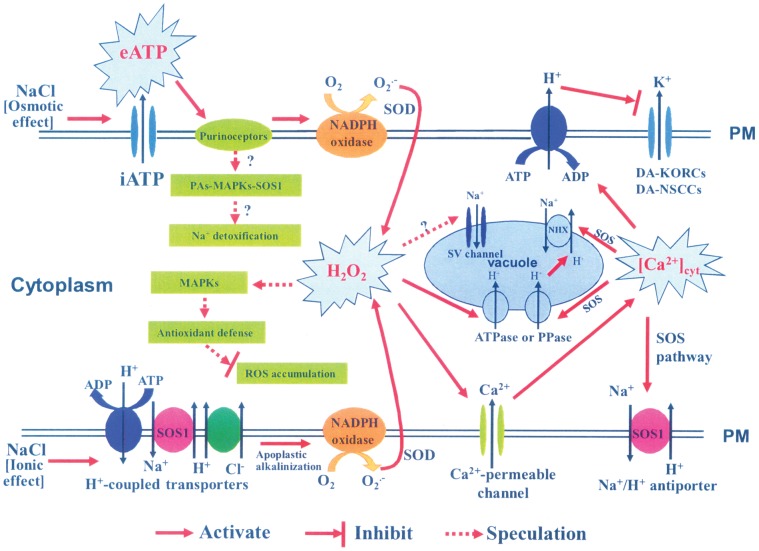
Figure 9. Schematic model shows proposed eATP signals that mediate the NaCl stress response in P. euphratica cells.
The top line (PM = double line) indicates the molecules involved in the osmotic sensor and associated responses to salt stress. The bottom line (PM = double line) indicates the molecules involved in the ionic sensor and associated responses to salt stress (see text for details). These sensors are separated in this diagram for clarity, but they are not expected to be relegated to separate compartments on the cell membrane.

