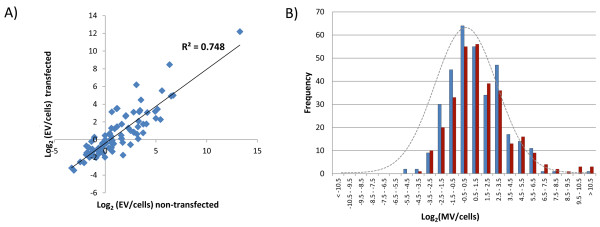
Figure 4.
Relative expression between cells and microvesicles.A) The ratios of the expression levels of individual miRNAs between cells and EVs remained reasonably constant following overexpression of exogenous miR146a expression, as illustrated by the strong correlation between the values. B) When expression levels in both cells and EVs were normalized to RPMM, more miRNAs were preferentially released in EVs than retained in cells: The histograms for both non-transfected (blue) and miR-146a overexpressing samples (red) are shifted to the right relative to a normal distribution (grey line).

