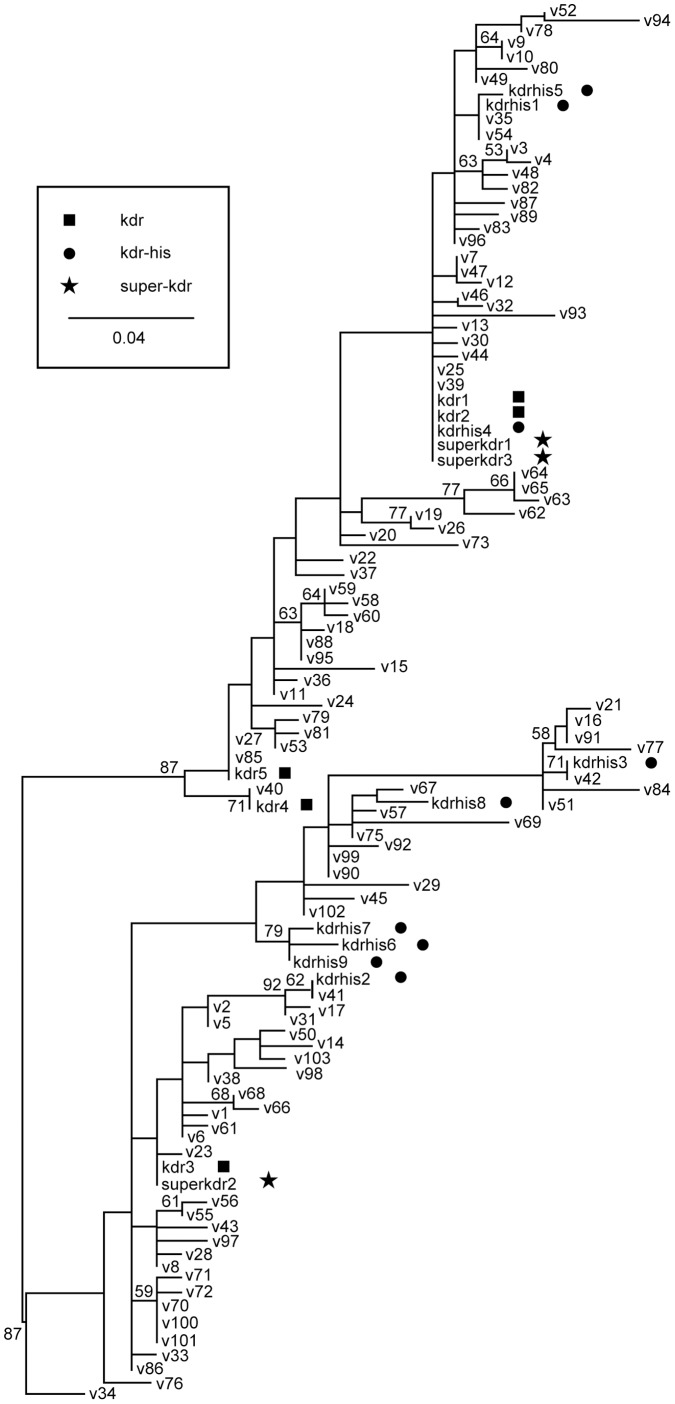
Figure 1. Maximum-likelihood phylogeny of Vssc alleles/haplotypes in house flies.
Tree is unrooted, and is shown here with a mid-point root for visualization only. Susceptible haplotypes are represented by v+number. Numbers at nodes represent the bootstrap values (%); only bootstrap values greater than 50% are shown.

