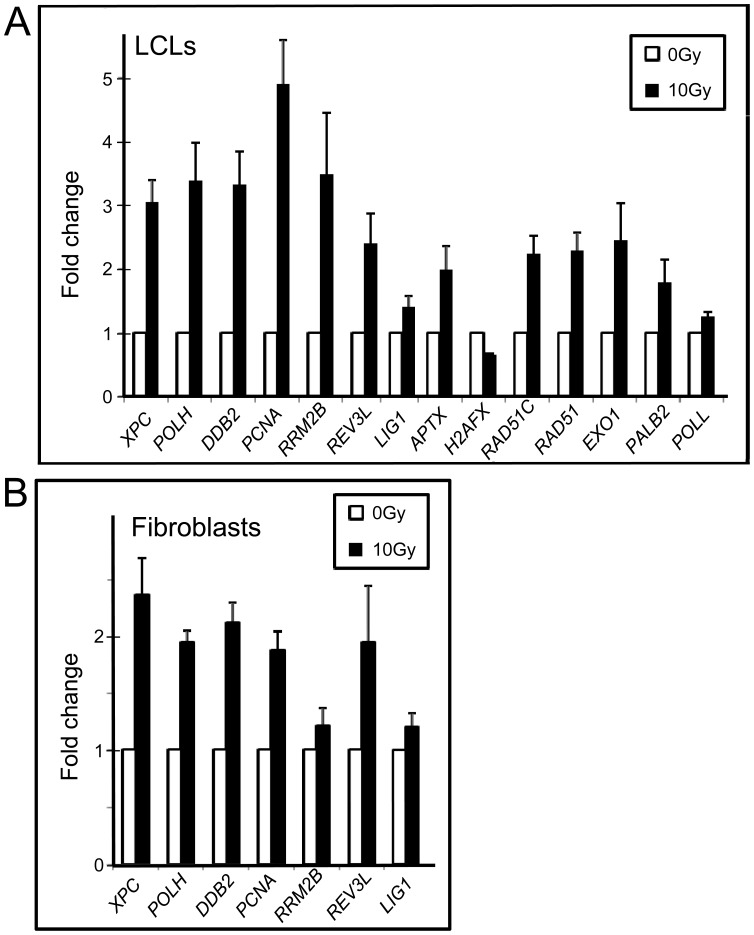
Figure 3. Validation of DNA repair gene expression modulation following 10 Gy IR using qRT-PCR.
Ct values were normalized to PGK. Each bar represents data from 12 different cell lines for both LCL (A) and primary fibroblasts (B) with the following exceptions: 6 samples were used for PCNA and RRM2B in the LCL experiments; 10 samples were used for XPC, RRM2B, REV3L for the fibroblast experiments and 5 samples for, EXO1, PALB2, LIG1 and H2AFX were used in the fibroblast experiments. Gene expression levels were averaged across multiple experiments. Four separate qRT-PCR runs were carried out for POLH, DDB2, APTX, RAD51C, and PALB2 genes; three separate qRT-PCR runs were carried out for PCNA, REV3L and EXO1 genes; and two separate qRT-PCR runs were carried out for XPC, RRM2B, H2AFX, and RAD51 genes. Error bars = SEM (n = 12). Each value on an experiment was run in triplicate. All differences shown are statistically significant (p<0.05) using a t-test. PSRs used for amplification are: XPC: PSR853; POLH: PSR124; DDB2: PSR663; PCNA: PSR213; RRM2B: PSR293; REV3L: PSR729; LIG1: PSR905; APTX: PSR338; H2AFX: PSR185; RAD51C: PSR786; RAD51: PSR100; EXO1: PSR239; PALB2: PSR346; POLL: PSR904 for which some are indicated by and arrow in figures 1 and 2 and all full PSR numbers can be found in Figures S1 and S2.

