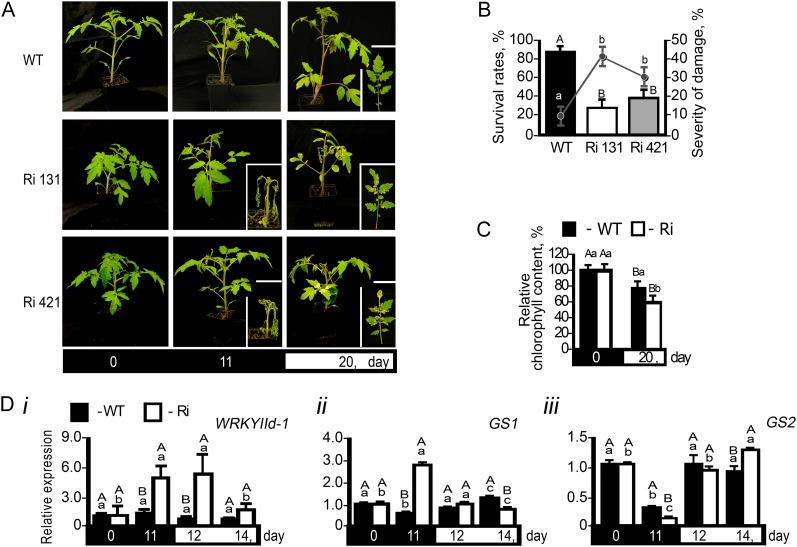
Figure 2.
The effect of 11-d dark stress on mortality and senescence-associated symptoms in tomato wild-type (WT) and SO Ri (Ri) plants. The days indicated on the black background represent dark treatment, and those on the white background represent the 16-h-light/8-h-dark regime. A, Photographs of wild-type and SO Ri plants (Ri 131 and Ri 421) after an 11-d dark treatment and subsequent 9-d recovery (total of 20 d) in a normal light/dark cycle. Closeups of mutant plants (day 11 in the dark) and leaves (20 d after treatment initiation) are presented in the insets. B, Survival rates (bars; left y axis) and damage level (line; right y axis) of wild-type and SO Ri plants evaluated at the day 9 of recovery. Error bars indicate se (n = 16). C, Leaf chlorophyll content at the day 9 of recovery. Error bars indicate se (n = 6). D, Quantitative transcript expression analysis of the senescence marker genes WRKYIId-1 (SGN-U563810; i), cytosolic Gln synthetase (GS1; SGN-U577193; ii), and chloroplastic Gln synthetase (GS2; SGN-U578319; iii). The relative expression after normalization to TFIID (SGN-U329249) is calculated by comparison with that of day 0 (set as 1.0). Error bars indicate se (n = 6). Different uppercase letters indicate significant differences between wild-type and SO Ri plants (Student’s t test; JMP 8.0 software; http://www.jmp.com/), and lowercase letters indicate significant differences within the plant species in response to treatment (Tukey-Kramer HSD test; JMP 8.0 software). The data for SO Ri plants represent means for SO Ri 131 and SO Ri 421 mutants.

