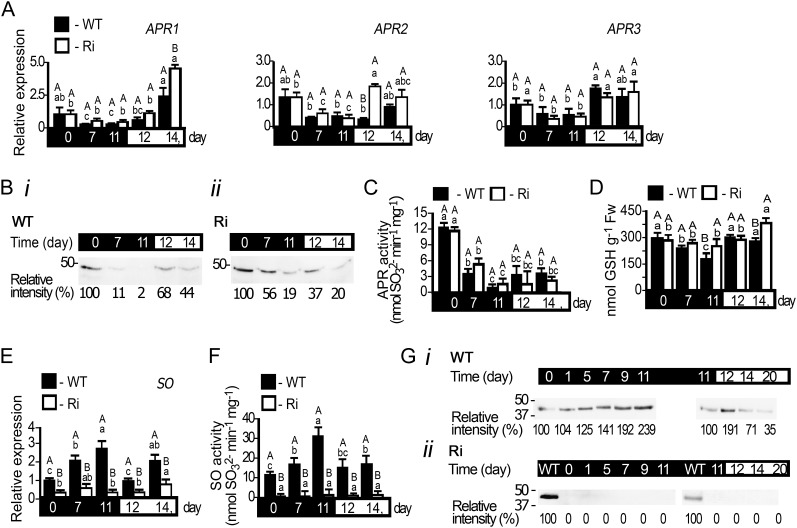
Figure 4.
APR and SO expression in tomato wild-type (WT) and SO Ri (Ri) plants as affected by extended dark stress. The days indicated on the black background represent dark treatment, and those on the white background represent the 16-h-light/8-h-dark regime. A, Transcript analysis of APR1 (SGN-U580331), APR2 (SGN-U580235), and APR3 (SGN-U578339). The relative expression after normalization to TFIID (SGN-U329249) is calculated by comparison with that of the wild type at day 0 (set as 1.0). Error bars indicate se (n = 6). B, APR proteins extracted from leaves of wild-type (i) and SO Ri (ii) plants, fractionated by SDS-PAGE, and immunoblotted with APR-specific antiserum. Each lane contains 10 µg of soluble proteins. The data are from one of three independent experiments that yielded essentially identical results. C, Activity analysis of APR detected by sulfite appearance. Error bars indicate se (n = 6). D, Accumulation of GSH, the APR substrate, in response to dark stress. Fw, Fresh weight. E, Transcript analysis of SO (DQ853413) calculated as described in A. F, SO activity detected as sulfite disappearance. Error bars indicate se (n = 6). G, SO proteins extracted from leaves of wild-type (i) and SO Ri (ii) plants, fractionated, and immunoblotted as described in B employing SO-specific antiserum. Error bars indicate se (n = 8). Different uppercase letters indicate significant differences between wild-type and SO Ri plants (Student’s t test; JMP 8.0 software), and lowercase letters indicate significant differences within the plant species in response to treatment (Tukey-Kramer HSD test; JMP 8.0 software). All data for SO Ri plants represent means for SO Ri Ri 131 and SO Ri 421 lines. For both SO Ri lines, representative in gel activities and immunoblot analyses are presented.

