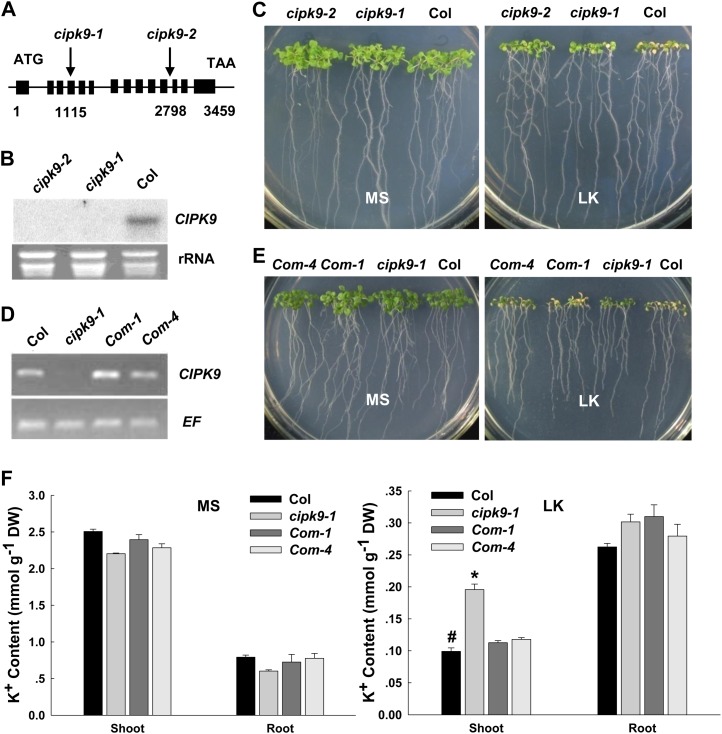
Figure 1.
Phenotype tests and K+ content measurements of cipk9 mutant plants, wild-type plants, and cipk9 complementation plants under LK stress. A, Structure of the CIPK9 gene. The boxes indicate exons and the lines represent introns. The T-DNA insertion sites in cipk9-1 and cipk9-2 are shown using arrows. B, Northern-blot analysis of CIPK9 expression levels in cipk9 mutants and wild-type plants. C, Phenotype comparison between cipk9 mutants (cipk9-1 and cipk9-2) and the wild type (Col) after growth on MS or LK medium for 12 d. D, Reverse transcription-PCR verification of CIPK9 expression levels in cipk9 complementation plants (Com-1 and Com-4). E, Phenotype comparison of wild-type plants (Col), cipk9-1 mutant plants, and complementation plants (Com-1 and Com-4) after growth on MS or LK medium for 12 d. F, K+ content measurements of various plant materials. The shoot and root K+ contents were measured after the plants were grown on MS or LK medium for 12 d. Data shown are means ± se (n = 3). Student’s t test (*P < 0.05) was used to analyze statistical significance compared with the control (#). DW, Dry weight.

