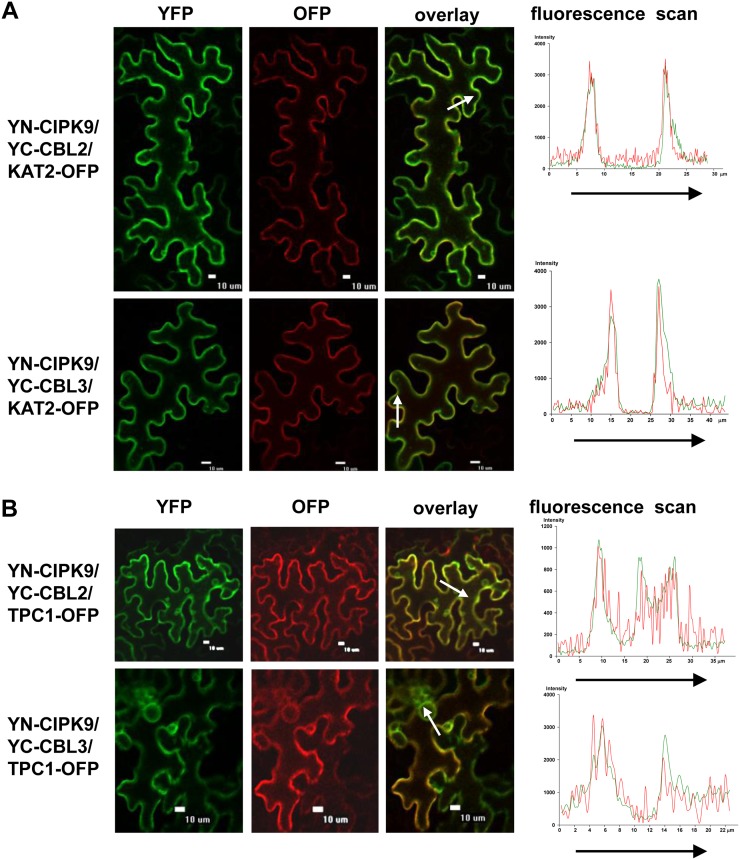
Figure 5.
BiFC assays of CIPK9 interaction with CBL2 and CBL3 in tobacco leaves. A, KAT2-OFP was coexpressed and used as a PM marker. B, TPC1-OFP was coexpressed and used as a tonoplast marker. Left panels, YFP images; middle panels, OFP images; right panels, merge of YFP and OFP images. Bars = 10 μm. The fluorescence intensities of the arrow-covered regions were determined and are shown at right.

