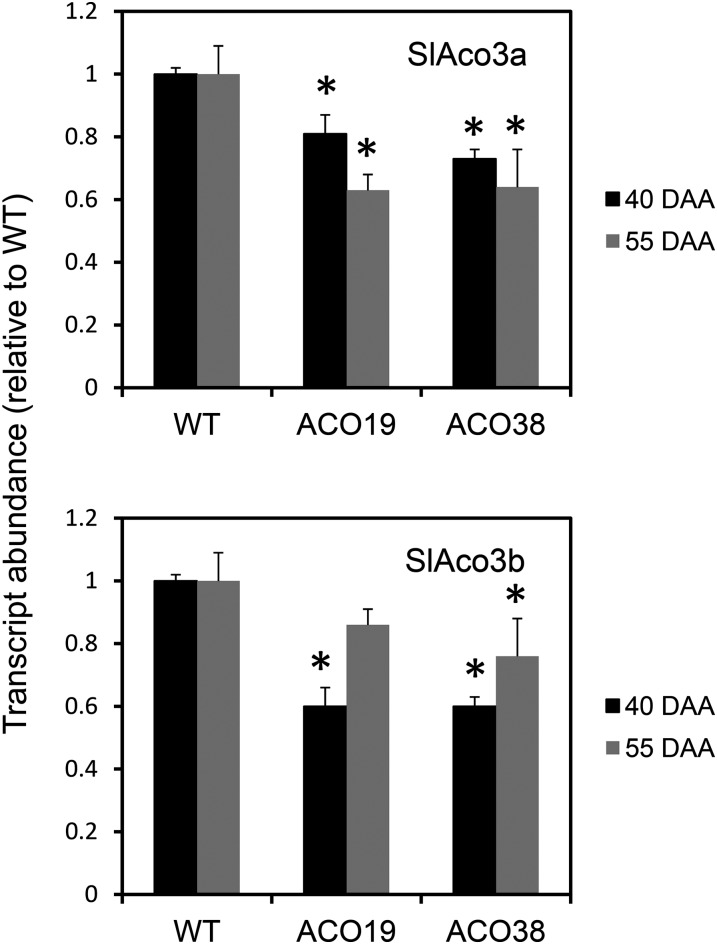
Figure 7.
Abundance of SlAco3a and SlAco3b transcripts in fruit from antisense transgenic lines. RNA was extracted from fruit from the wild type (WT) and transgenic lines (ACO22 and ACO38) at 40 and 55 DAA. SlAco3a and SlAco3b transcripts were quantified by quantitative real-time PCR. Mean abundance values (relative to the wild type) ± se of three biological replicates are shown. *Significantly different from the wild type (Student’s t test, P < 0.05).

