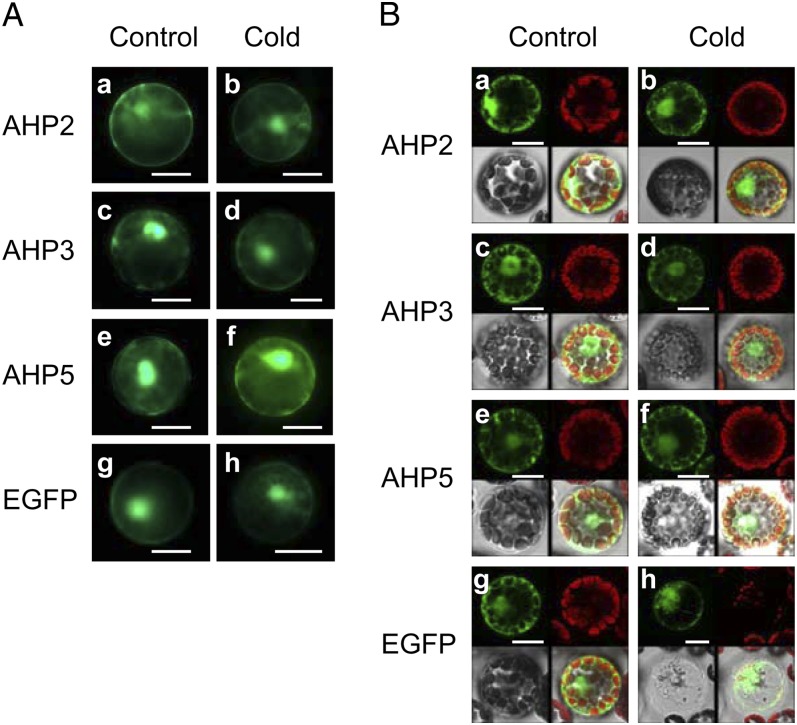
Figure 6.
Analysis of the subcellular distribution of AHP2-EGFP, AHP3-EGFP, and AHP5-EGFP in the wild-type Arabidopsis mesophyll protoplasts. A, Representative fluorescence micrographs of protoplasts transfected with plasmids encoding different AHP-EGFP fusion proteins. a, c, e, and g show the protoplasts at 23°C, and b, d, f, and h show the protoplasts treated at 1°C for 3 h. Representative images are shown from three independent experiments. Bars = 10 µm. B, Representative confocal scanning laser micrographs of protoplasts transfected with plasmids encoding different AHP-EGFP fusion proteins. a, c, e, and g show the protoplasts at 23°C, and b, d, f, and h show the protoplasts treated at 1°C for 1 h. Representative images are shown from two independent experiments. The top panels show epifluorescence from EGFP and autofluorescence (chloroplast), and the bottom panels show bright-field images and merged images from left to right, respectively. Bars = 10 µm.

