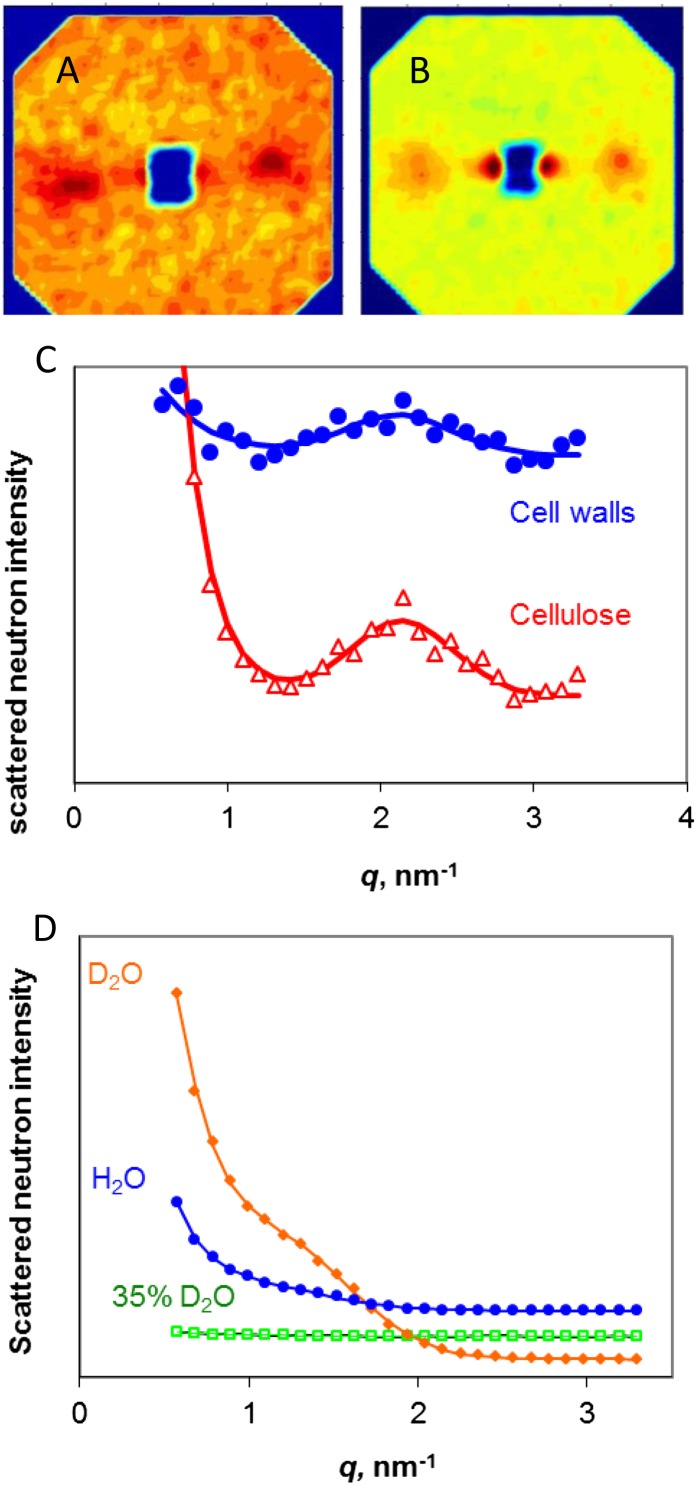
Figure 1.
SANS from celery collenchyma cell walls and cellulose. A, SANS pattern for dry cell walls. B, SANS pattern for dry, isolated cellulose. In A and B, the fiber axis is vertical. C, Equatorial scattering profiles from cell walls and isolated cellulose. The fitted line is the sum of an exponential function corresponding to noncoherent scattering and a Gaussian function corresponding to the equatorial Bragg peak arising from diffraction from the packing arrangement of the microfibrils. D, Equatorial scattering profiles from cellulose saturated with water, D2O, or a 35% [D2O]/[D2O + water] (v/v) mixture matching cellulose in contrast. The vertical scale is greater than in C by a factor of 150. [See online article for color version of this figure.]

