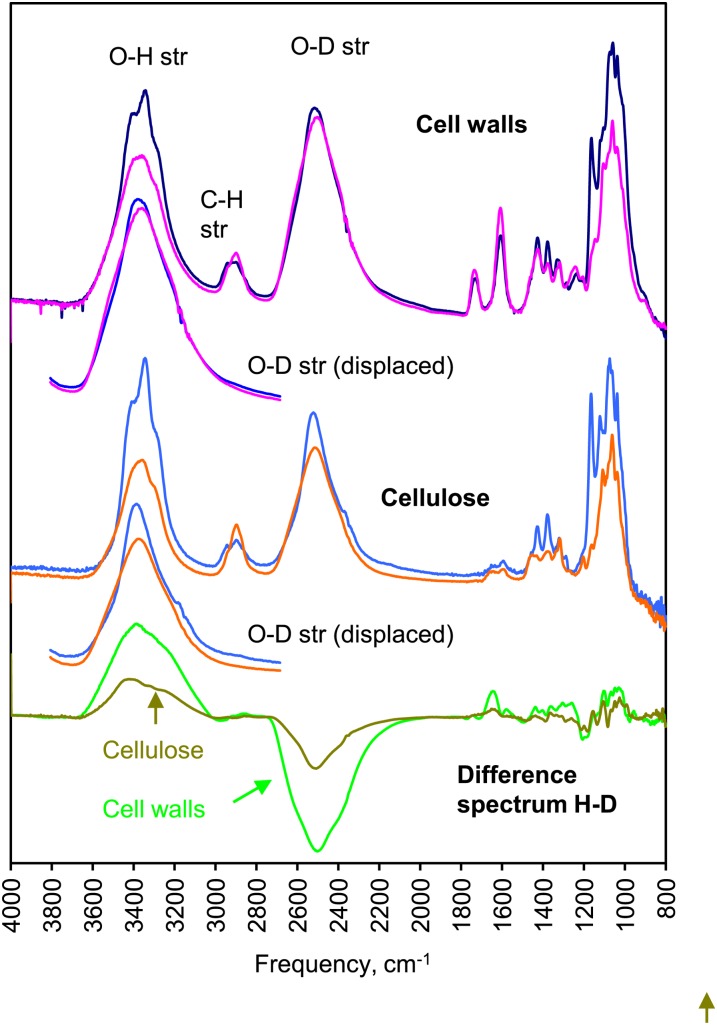
Figure 5.
Polarized FTIR spectra of celery collenchyma cell walls and isolated cellulose subjected to vapor-phase deuterium exchange and dried without contact with water. Solid lines show longitudinal polarization, and dotted lines show transverse polarization. For comparison with the O-H stretching region (3,000–3,500 cm−1), the O-D stretching region (2,200–2,700 cm−1) is also shown with the wavelength scale increased by a factor of 1.34. Difference spectra (H − D) are shown below. [See online article for color version of this figure.]

