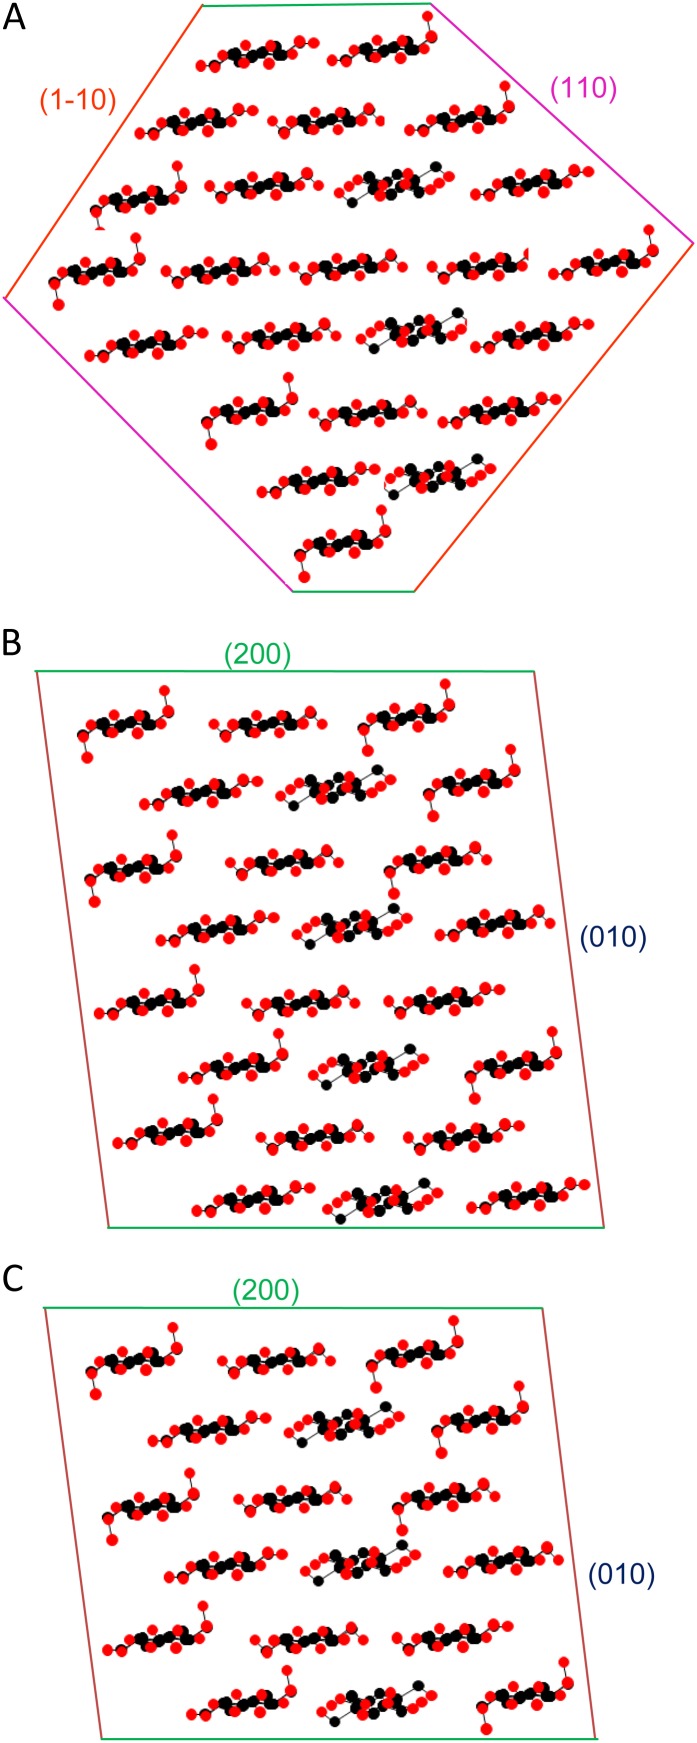
Figure 6.
Models for the cross section of celery collenchyma microfibrils. A, A 24-chain diamond-shaped model, 2.9 × 2.7 nm. B, A 24-chain rectangular model, 3.3 × 2.7 nm. C, An 18-chain rectangular model, 2.5 × 2.7 nm. The WAXS column lengths (Scherrer dimensions) after correction for disorder provide a means to distinguish between these models, with caution due to the difficulty of estimating the widths of the overlapped 1-10 and 110 reflections, the approximations involved in the disorder correction, and the possibility that the microfibril cross sections might vary. Calculated [200], [1-10], and [110] column lengths were as follows, respectively: model A, 2.5, 2.8, and 2.5 nm; model B, 3.2, 2.6, and 2.5 nm; model C, 2.4, 2.5, and 2.3 nm. The observed column lengths were as follow: [200], 3.2 nm; [1-10] and [110], mean of 2.5 nm. On this basis, the best-fit model was model B. [See online article for color version of this figure.]

