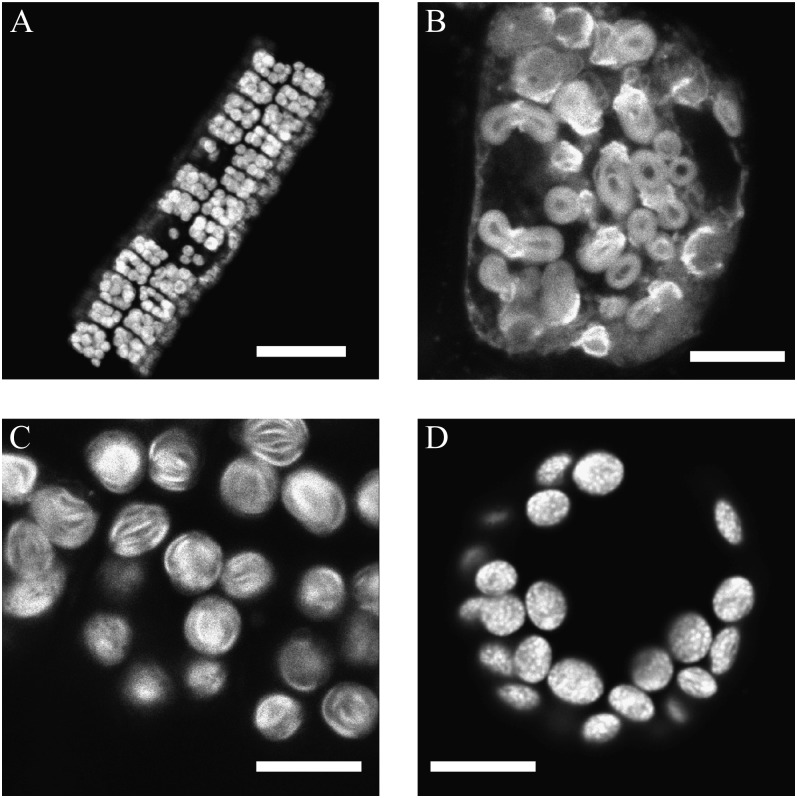
Figure 1.
CLSM images of BS strands and M protoplasts of maize and sorghum. The images show natural chlorophyll fluorescence. A, Low-resolution image of an isolated BS strand from maize. B, Closeup CLSM image of a BS cell from maize. C, Chloroplasts within a BS strand of sorghum. D, Chloroplasts within a protoplast isolated from Arabidopsis. Note the small bright spots representing grana discs. Bars = 50 μm (A) and 10 μm (B–D).

