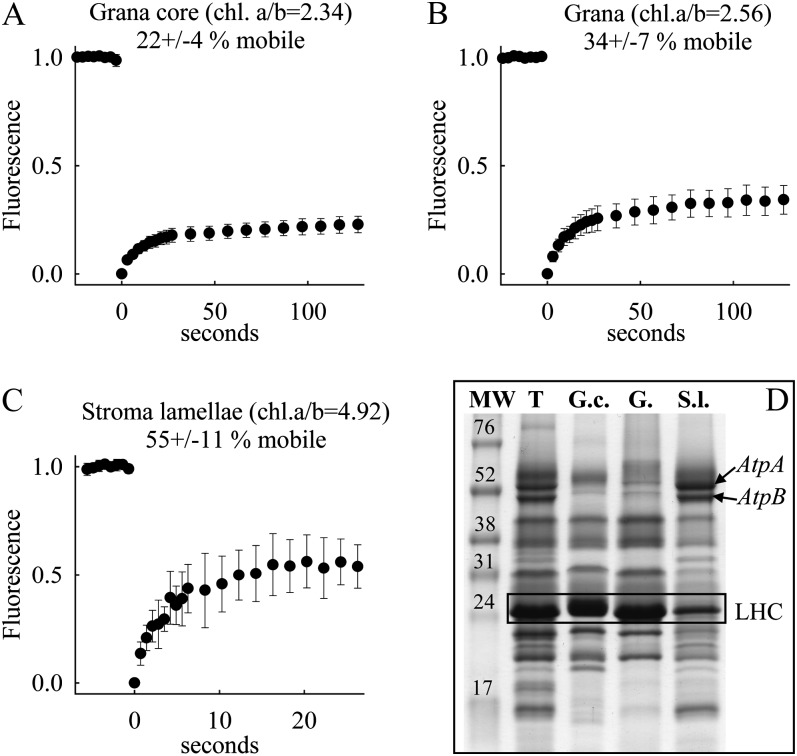
Figure 5.
A to C, Fluorescence recovery kinetics for grana core (A), grana including margins (B), and stroma lamellae (C) isolated from Arabidopsis. The data shown represent mean values with sd of 14 to 19 measurements collected from one preparation. D, SDS-PAGE analysis showing protein composition of the thylakoids (T), grana core (G.c.), grana (G.), and stroma lamellae (S.l.) preparations. An amount of sample corresponding to 5 μg of chlorophyll per lane was loaded into each well. Apparent molecular weights were estimated by coelectrophoresis of a low-molecular-weight protein standard (MW; Invitrogen). Bands for the ATPase subunits (AtpA and AtpB protein) as an indicator of unstacked stroma lamellae are depicted. In addition, the LHCII band is boxed as an indicator of stacked grana.

