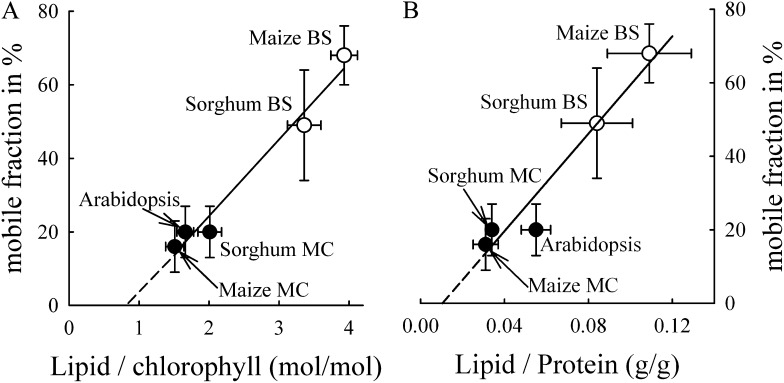
Figure 6.
Dependency of the mobile fraction determined from FRAP measurements on the lipid-chlorophyll ratio (A) or the lipid-protein ratio (B). Data represent means with sd. Further statistical information for the mobile fraction is given in Figure 4 and for the lipid-chlorophyll data in Table I. The lipid-protein ratio data were collected from two to four independent measurements. The regression line for A is y = −17.3 + 20.8x (r2 = 0.973). For B, the regression equation is y = −6.9 + 663.1x (r2 = 0.973). MC, M cell.

