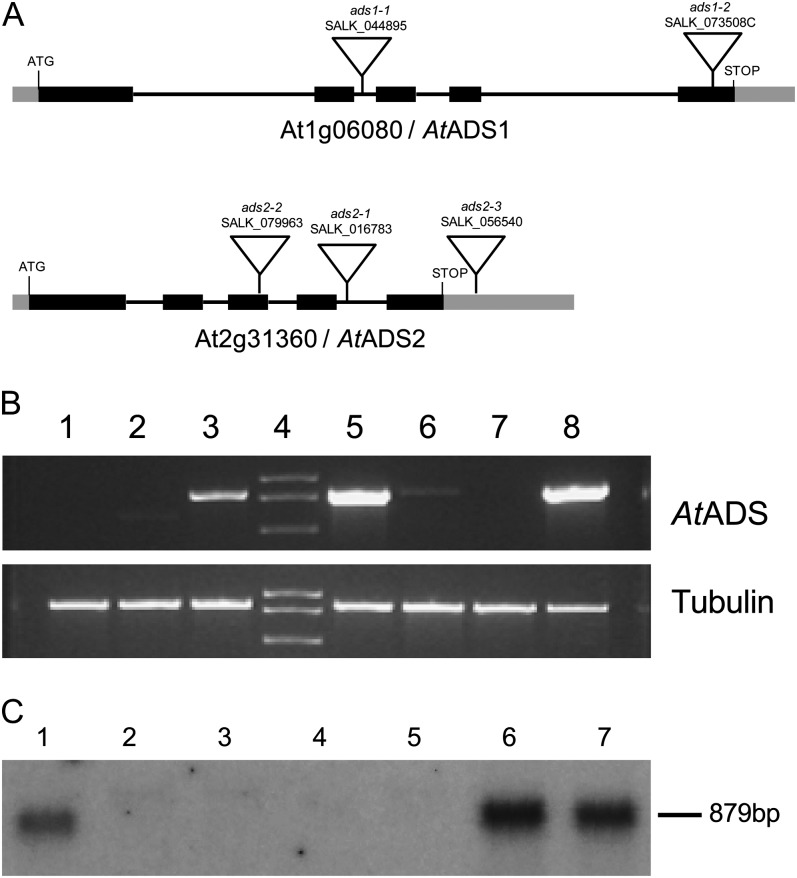
Figure 6.
Characterization of ads1 and ads2 T-DNA insertion alleles. A, Gene structure and T-DNA insertion sites. Black boxes indicate exons, black lines indicate introns, and gray boxes indicate untranslated regions of the cDNA. B, RT-PCR showing gene expression. Template is cDNA generated from total RNA extracted from rosette leaves. Lane 1, ads1-2; lane 2, ads1-1; lanes 3 and 5, wild type; lane 6, ads2-1; lane 7, ads2-2; lane 8, ads2-3. Primer pairs: Top, RTADS1F2 and RTADS1R2 for lanes 1 to 3 and RTADS2F and RTADS2R for lanes 5 to 8. Bottom, Tubulin β-7 chain (At2g29550), primers AtTub2For and AtTub2Rev. C, Northern blot using AtADS2 cDNA as a probe. Lane 1, Wild type; lanes 2 and 3, ads2-1; lanes 4 and 5, ads2-2; lanes 6 and 7, ads2-3.

