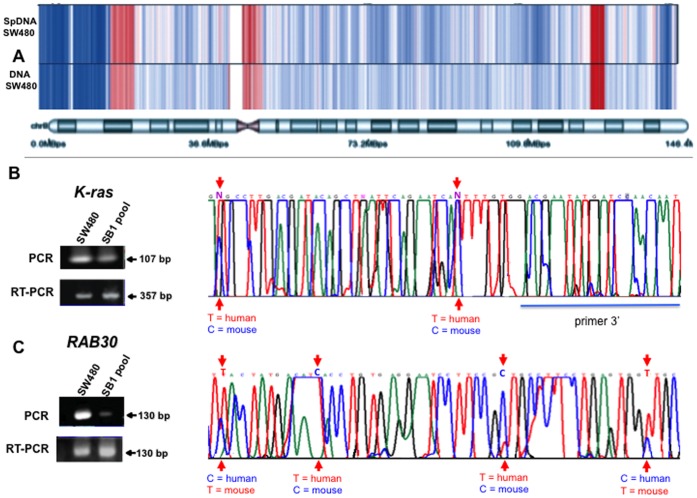
Figure 3. DNA copy number analysis of extracellular and intracellular DNA from SW480 cells and gene transfer to murine NIH3T3 cells. A.
Heat map representing the DNA copy number along chromosome 8. Blue represents regions with deletions and red regions with amplifications. A nearly identical pattern of DNA copy number changes between extracellular (SpDNA SW480) and intracellular (DNA SW480) DNA, compared to a common normal reference can be observed. RT-PCR, PCR and sequencing of Human K-ras (B) and RAB30 (C). Negative control was NIH3T3 cells.

