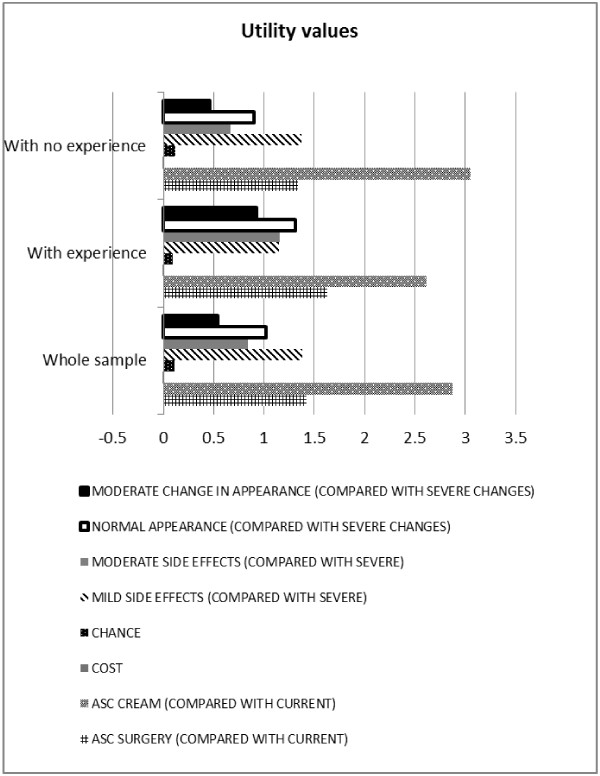
Figure 2.
Modelling patient preferences: Utility values. Note: This Figure reports on average values only, whilst the complete output from the logistic regression model is presented in Tables 3 (whole sample) and 4 (subgroups with experience and with no experience of BCC symptoms and treatment). Alternative specific constants (ASC) for surgery (ASC SURGERY) and for cream (ASC CREAM) show the preferences of these alternatives relative to the current situation, everything else being equal. The cost attribute reported a mean value of −0.0031, and therefore it is less noticeable than the other attributes. Due to differences in scale factors across data sets, utility values from different subgroups are not directly comparable. For comparison between subgroups with experience and with no experience of BCC symptoms and treatment please see marginal WTP (Figure 3) and proportion of respondents (Figure 4). Overall findings from subgroup analyses are also presented in Table 4.

