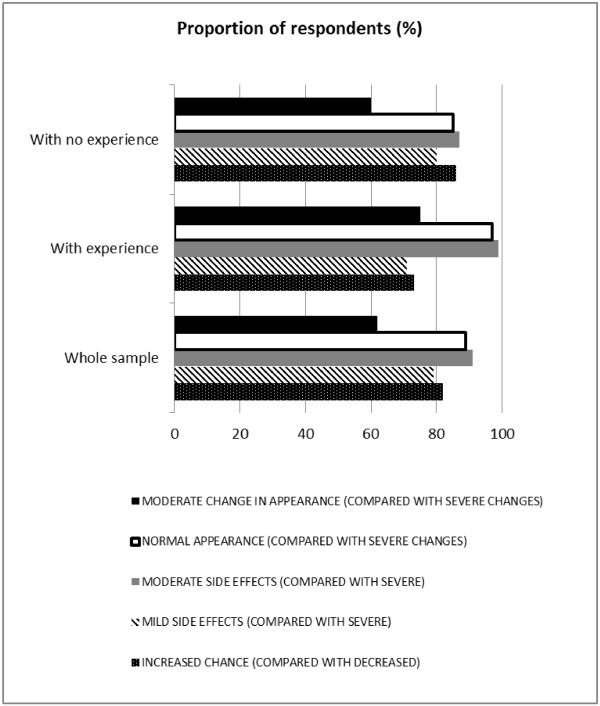
Figure 4.
Modelling patient preferences: the proportion of respondents (%) with positive effect of particular characteristic. Note: The output from the logistic regression model used to inform these estimates is presented in Tables 3 (whole sample) and 4 (subgroups with experience and with no experience of BCC symptoms and treatment, and their comparison). For ‘MODERATE SIDE EFFECTS’ and ‘NORMAL APPEARANCE’ differences in preference distribution between subgroups (with experience vs. with no experience of BCC symptoms and treatment) are significant at the 95% level.

