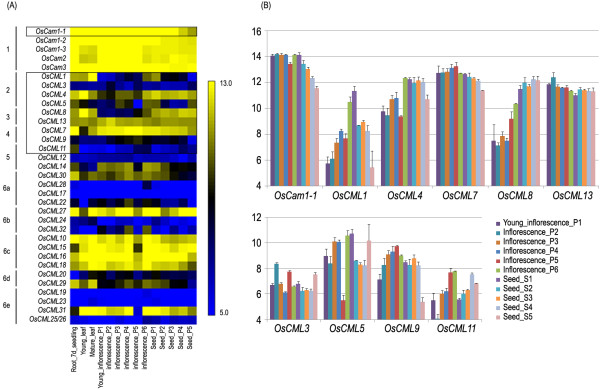
Figure 1.
OsCam and OsCML gene expression in various organs and developmental stages based on DNA microarray.(A) Expression profiles of the Cam and CML genes in the O. sativa IR64 cultivar shown as a heat map. The groupings designated as 1–6 based on the phylogenetic analysis of CaM and CML proteins are indicated on the left and the colour scale is shown on the right. (B) and (C) Expression profiles of OsCam1-1 and the nine CML genes shown as bar graphs. Data in (B) and (C) are shown as the mean ± 1 SD, and are derived from three independent replicates.

