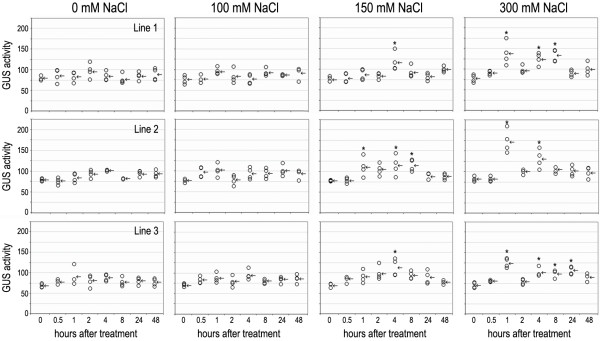
Figure 5.
GUS activity of the three transgenic rice lines over-expressing OsCam1-1:gus under salt stress. Each circle and arrow indicates each value of GUS activity (units per μg protein) and the mean of those values, respectively. The asterisks indicate significantly higher GUS activity compared with their respective control (p < 0.05).

