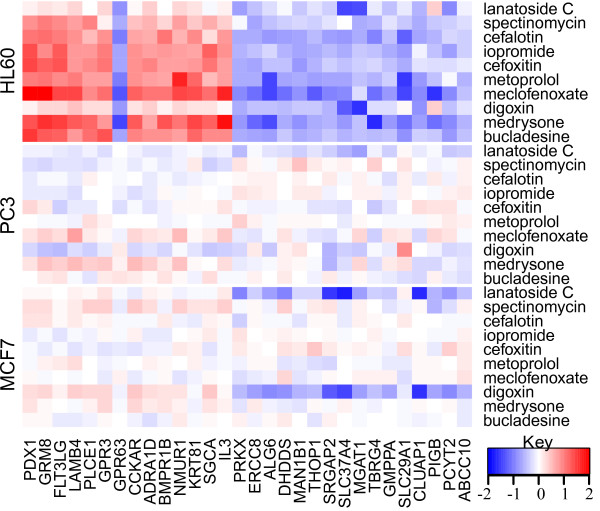
Figure 7.
Heatmap for subcomponent 7B. Y-axis lists the top 10 active compounds in the component, replicated over the three cell lines, while the X-axis lists the most significantly active genes in the component. The genes are clearly activated systematically and exclusively in the HL60 cell line, hence indicating an HL60 specific response.

