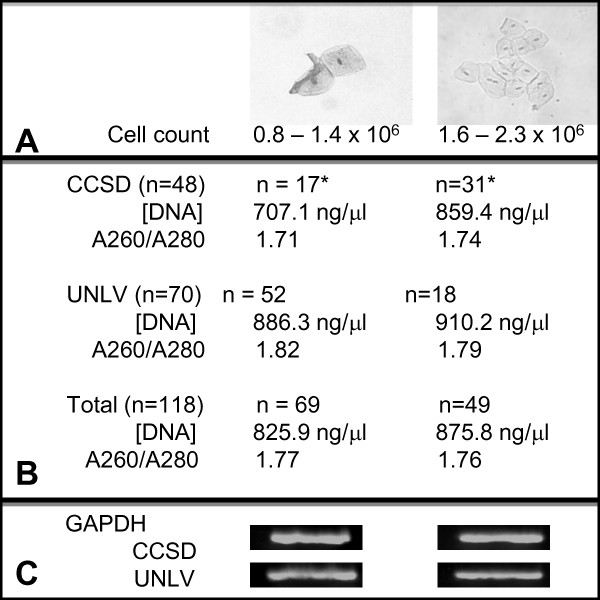
Figure 1.
Saliva sample analysis: cell count, DNA isolation and purity. A) Following centrifugation and cell resuspension in saline, cell number for each sample was determined revealing three-fourths of the UNLV samples were observed to have lower cell counts (0.8-1.4 x 10⁶ cells/mL) while only one-third of CCSD sample were estimated* to have lower cell counts. B) DNA concentrations were found to be higher from the high-cell count samples within each cohort (CCSD: 859.4 and 707.1 ng/μL, respectively; UNLV: 886.3 and 910.2 ng/μL, respectively). DNA purity averaged between 1.71 and 1.82. C) Equal concentrations of extracted DNA (1 μL) was screened using GAPDH, which revealed no considerable variation in band intensity between cohorts of samples from high- and low-cell count categories.

