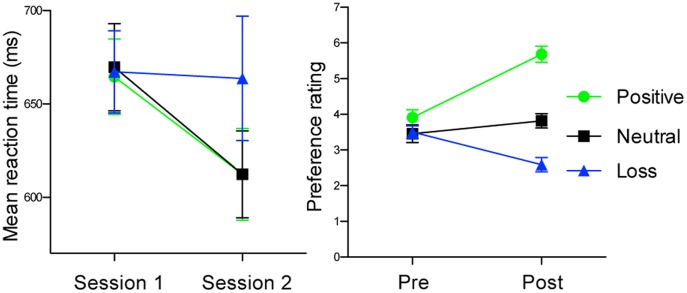
Figure 2. Results in acquisition phase.
(A) Mean reaction times for auditory stimuli in session 1 and session 2. Bars represent standard errors. (B) Pleasantness ratings for auditory stimuli in pre- and post-acquisition sessions. Green, black and blue lines show auditory stimuli paired with positive, neutral and negative outcomes, respectively. Bars represent standard errors.

