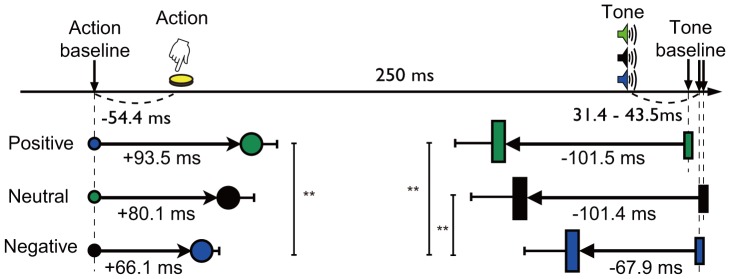
Figure 4. Physical and perceived onset timings of events.
From top row, figure shows physical timing of action and tone, perceived timing for positive, neutral and negative outcomes, respectively. Small and large circles show mean perceived timing of action in the baseline (action) condition and the operant (action) condition, respectively. Small and large rectangles show mean perceived timing of tone in the baseline (tone) condition and the operant (tone) condition, respectively. Bars represent standard errors.

