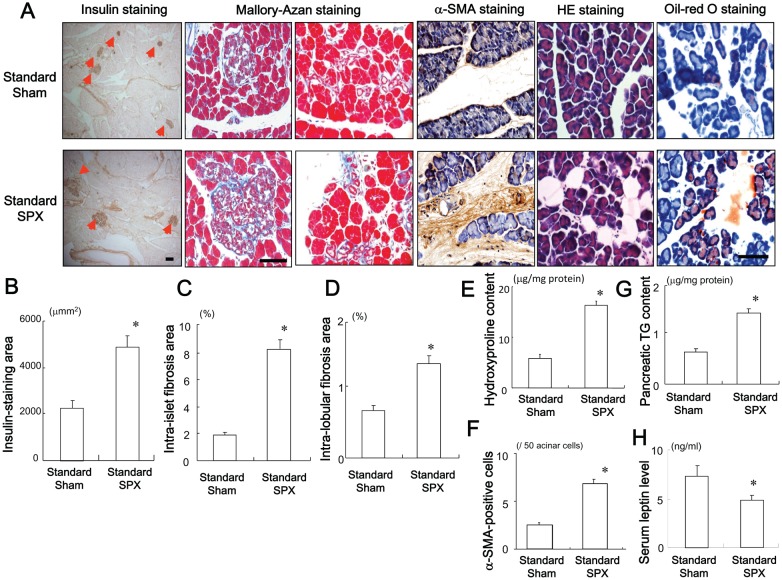
Figure 1. Effects of SPX on islets and fat accumulation in the pancreas.
(A) Representative images of insulin staining (left), Mallory-Azan staining (middle), and H&E staining (right) of pancreas sections from mice in each group. (B−E) Insulin staining area (B), intra-islet fibrosis area (C), intra-lobular fibrosis area (D), hydroxyproline content (E), α-SMA-positive cells (F), TG content (G) in the pancreas and serum leptin level (H) in each group (n = 6). *P<0.05 vs. the Standard-Sham group. Scale bar = 100 µm. Treatment groups: Standard-Sham, fed standard chow and sham-operated; Standard-SPX, fed standard chow and splenectomized.

