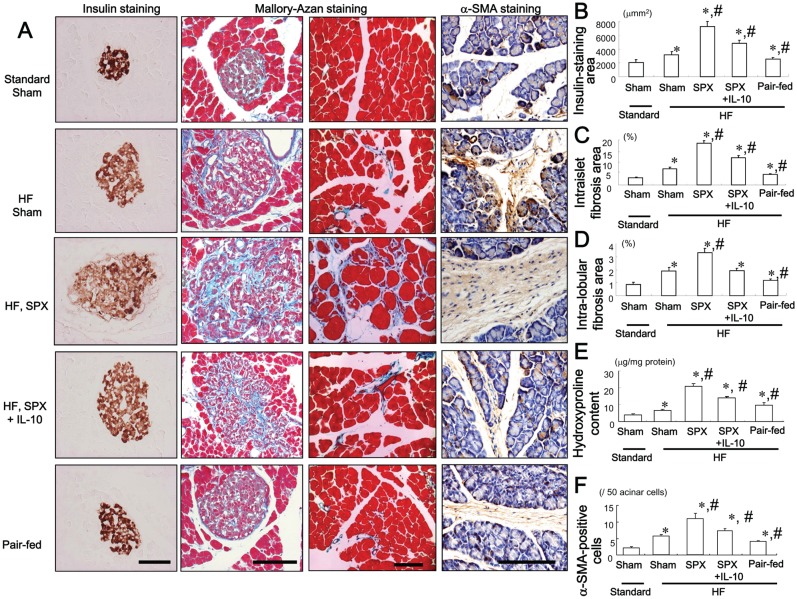
Figure 3. Systemic administration of IL-10 diminishes SPX-induced alterations in pancreatic islets.
(A) Representative images of insulin staining (left) and Mallory-Azan staining (right) in pancreas sections from each group. Scale bar = 100 µm. (B−F) Insulin-staining area (B), intra-islet (C) and intra-lobular (D) fibrosis area, hydroxyproline content (E) and α-SMA-positive cells (F) in the pancreas in each group (n = 6). *P<0.05 vs. the Sham-Standard group, # P<0.05 vs. the Sham-HF group. Treatment groups: Standard-Sham, fed standard chow, given serum albumin, and sham-operated; HF-Sham, fed a HF diet, administered serum albumin, and sham-operated; HF-SPX, fed a HF diet, given serum albumin, and splenectomized; HF-SPX+IL-10, fed a HF diet, given IL-10, and splenectomized; Pair-fed, administered serum albumin, sham-operated, and fed the same amount of food as that consumed by the HF-SPX group.

